
 Exchange Ranking
 Top Exchanges
 24h Volume Ranking
 Popularity Ranking
 Exchange BTC Balance
 Proof of Reserves
 Decentralized Exchanges
 Funding Rate
 Funding Heatmap
 Liquidation Data
 Max Pain
 Long/Short Ratio
 Whale L/S Ratio
 Binance/Okex/Huobi L/S
 Bitfinex Margin L/S
 ETF Tracker
 Solana ETF
 XRP ETF
 Hong Kong ETF
 Bitcoin Treasuries
 Crypto Reversal
 Ethereum Reserves
 HyperLiquid Wallet Analysis
 Hyperliquid Whale Watch
 Large Transactions
 On-chain Movement
 Bitcoin ROI
 Stablecoin Market Cap
 Options Analysis
 News
News Articles
 Economic Calendar
 Features
 Wallet
 Contract Calculator


 Security
 Collections
 Watchlist
 Following
$ZAMA Price Analysis
$ZAMA has just hit a record high of about US$0.06514 before encountering strong resistance and falling below the uptrend line that had previously driven it up.
Zama is a project to build fully homomorphic encryption technology, aiming to realize confidential computing on the blockchain. Its own data shows that 63% of the current circulation supply has been pledged. This article's Zama price forecast will explore whether this correction is a healthy correction or the beginning of a larger trend. Keep reading to find out how key price points rank.
ZAMA Prices Today: Market Overview
Prices (ZAMA/USD): US$0.05131
24-hour change: +2.5%
24-hour interval: US$0.05035-US$0.0642
Market Value: $124.8 million (+8.04%)
Unlocked market value: US$145.98 million
Fully diluted valuation: US$634.52 million
24-hour trading volume: US$136.51 million (-7.47%)
Total locked value (TVL): US$48.07 million
Circulation supply: 2.2 billion $ZAMA
Total supply: 11.19 billion $ZAMA
Maximum supply: Uncapped
Number of holders: 7,940 people
ZAMA Cryptocurrency News: Latest News
Zama's official account announced that the second quarter version of the "Shielded" report will be released next Monday (July 27). The report, produced in conjunction with @therollupco, tracks the network health of the Zama protocol, confidential token adoption, and the institutional and developer ecosystem built on its confidential computing protocol.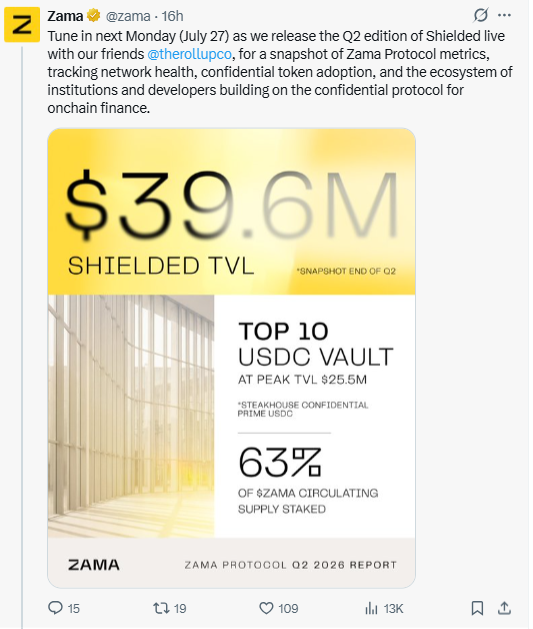
At the same time, Zama shared a preview snapshot at the end of the second quarter: Shielded TVL totaled US$39.6 million, the top ten USDC treasury TVL peaked at US$25.5 million, and 63% of the $ZAMA supply in circulation is currently in pledge status. 
In addition, Zama also announced the winners of the Bounty Track Season 3 developer program on the main network. These developers have built apps based on Zama's official Wrapper Registry: @realchriswilder's cToken,@harsh1900h's Vesper, and @saitama_xc's Blackout. Both of the above updates are official announcements of the Zama agreement.
ZAMA whale concentration: Chain holder data
Etherscan data for the $ZAMA contract shows that the maximum total supply on the chain is approximately 11.2 billion tokens, with 4,604 holders, and a chain listing value of US$634,424,858. The number of holders differs from the 7,940 people in the price tracker above, which may be due to the fact that $ZAMA is tracked on multiple chains. 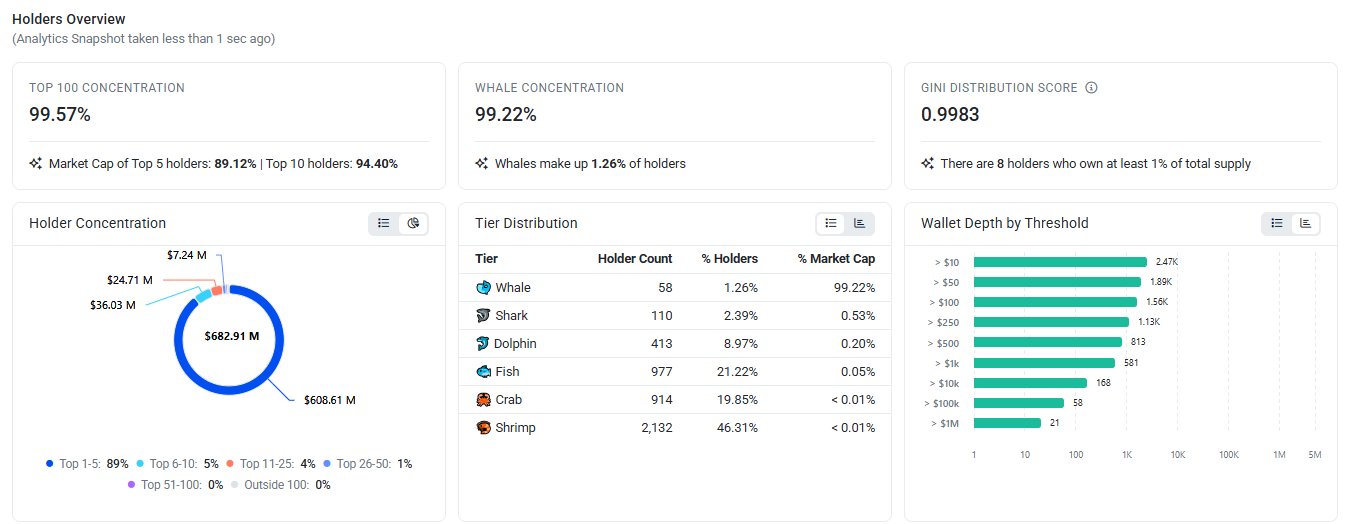
From the data, the concentration is extremely high: the top 100 wallets hold 99.57% of the supply, and whales alone (accounting for 1.26% of all holders) control 99.22%. The Gini coefficient is 0.9983, of which 8 wallets each hold more than 1% of the supply. The top 5 wallets hold 89.12% of the market value. 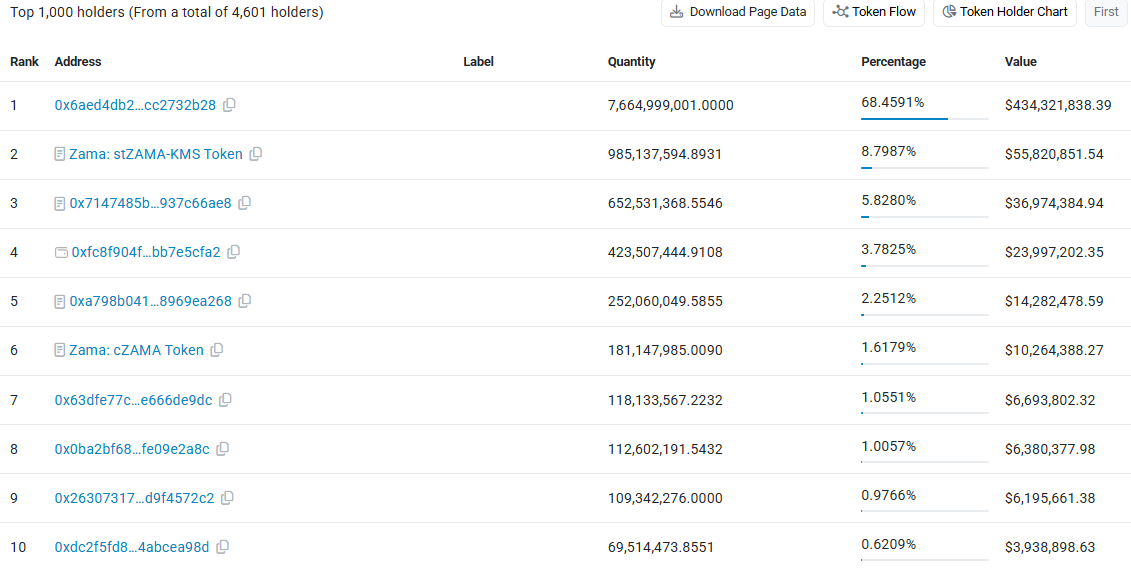
However, this needs to be viewed in conjunction with the background. The largest holders are not personal wallets, but official agreements. The second-ranked holder (8.80% of supply) is labeled "$Zama: stZAMA-KMS Token", which is a pledge contract; the sixth-ranked holder (1.62%) is labeled "Zama: cZAMA Token", which is a confidential token wrapper. The largest single address (68.46% of supply, unlabeled) is likely to be the treasury, vesting or bridging contract given its size. A significant part of this concentration reflects protocol design: according to Zama's own data, pledges currently hold 63% of supply, rather than purely speculative whale hoarding.
ZAMA 2026 Forecast: Chart Analysis
Trading Pair: $ZAMA/USDT| Exchange: KuCoin| Time frame: 1 hour| As of: July 25, 2026, 15:20 UTC+5:30
$ZAMA was in a narrow sideways position from July 20 to 22, roughly around US$0.04127, and then broke through strongly on July 23, following the steep uptrend line all the way to this day. The rally pushed the price to a record high of $0.06514, and then a sharp reversal candle sent the price down 10.19% to $0.05131, decisively falling below the uptrend line that had supported the entire rally.
EMA readings (20: 0.05594, 50: 0.05319, 100: 0.04934, 200: 0.04458) show that current prices have fallen below the 20-and 50-day EMA, but are still above the 100-and 200-day EMA, which means that the broader uptrend structure has not yet been completely disrupted, but short-term momentum has weakened significantly.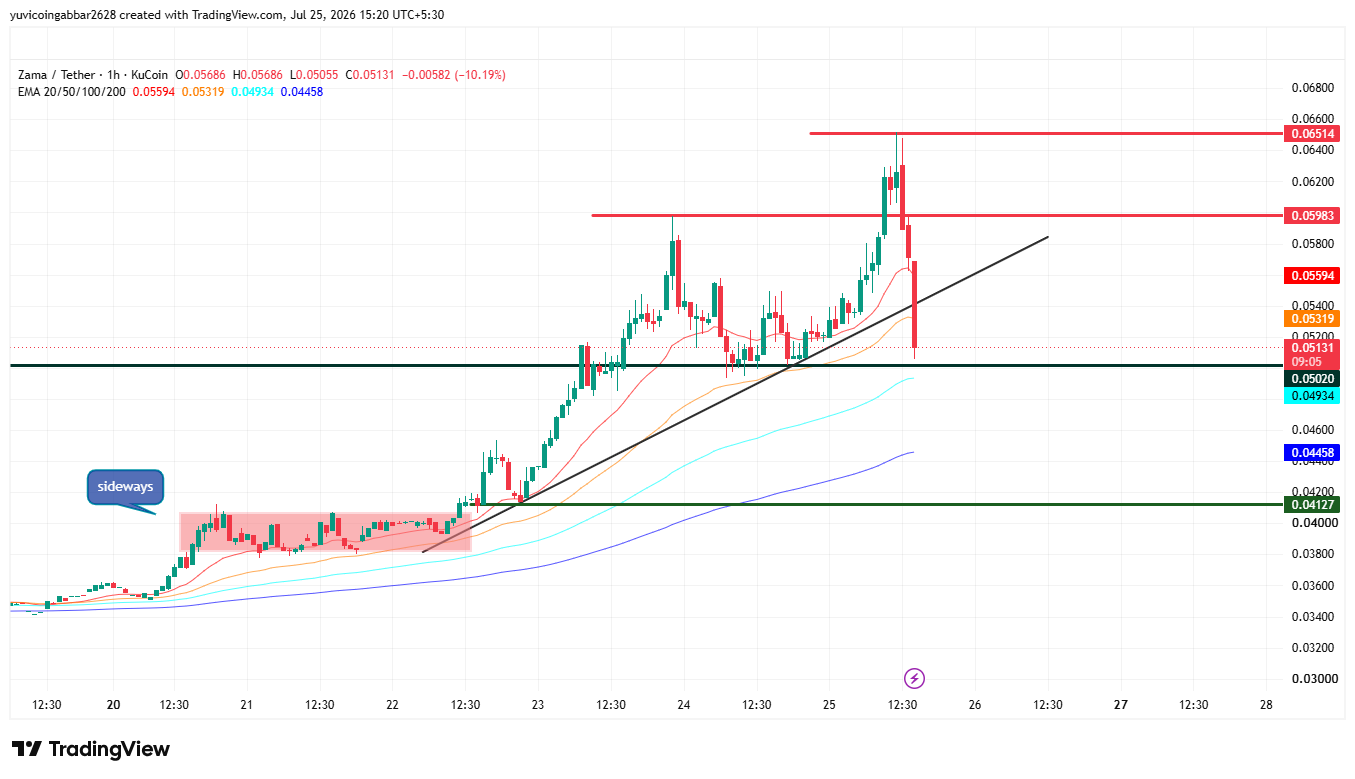 The US$0.0502 level, which was a resistance level before the breakthrough, has now become the first real test of whether this correction is a normal retracement or a deeper reversal.
Key price:
Historical high: US$0.06514 (Record high set this morning)
Resistance: US$0.05983 (Previous high before correction)
Current reference price: US$0.05131 (Current price after falling sharply from record highs)
First support level: US$0.05020 (Front resistance, now a key retest area)
Deeper support: US$0.04127 (bottom of the front sideways range)
ZAMA price forecast: Scenario analysis
Bullish scenario: Target price 0.05983, probability 30%. Triggering conditions: The daily closing price returned to above US$0.0502 and trading volume increased, viewing this decline as a wash. Confirmation level: Stand firm on two or more consecutive candle lines above $0.0502. Time frame: 3 to 7 days. Expiration conditions: The closing price fell below $0.04127 again.
Baseline scenario: Price range US$0.04127 to US$0.0502, probability of 45%. The market consolidated sideways after being blocked from digesting a record high. Prices continue to operate within the range for several trading days. Time frame: 3 to 7 days. Failure condition: The daily closing price breaks through either side of the range.
Bear scenario: Target price is US$0.04127, probability of 25%. Trigger condition: US$0.0502 failed to hold, confirming that the trend line broke into an effective reversal. Confirmation level: Daily closing fell below US$0.0502 and trading volume increased. Time frame: 3 to 7 days. Failure condition: Recovering $0.0502 as volume increases.
The probability weights are biased towards the benchmark scenario because the broader uptrend (prices are still above the 100-day and 200-day EMA) has not been technically disrupted, but the magnitude of today's reversal candle and the confirmed breakout of the trend line make the bearish scenario riskier than a typical pullback scenario.
Can ZAMA rise to US$0.05983 again?
In a bullish scenario, a retest of US$0.05983 is possible, but it depends on whether US $ZAMA can first recover and hold the US$0.0502 region-which served as resistance before the initial breakout. If it cannot be recovered, it is unlikely that recent highs will be retested in the short term.
What might invalidate a bullish scenario?
The bullish scenario will expire when the daily close falls below US$0.04127 (the bottom of the previous sideways range). If the first test of $0.0502 fails to hold and trading volume shrinks, it will also be an early warning sign that buyers are not re-entering.
Two scenarios: rebound vs break
rebound scenarios: If ZAMA regains US$0.0502 and holds it even as volume rises, then the correction is likely to be seen as a normal wash after a parabolic market, opening the way for a return to US$0.05983. The condition for this view to expire is if the closing price falls below $0.04127 again.
Break scenario: If US$0.0502 fails to hold, ZAMA may face a deeper decline towards the US$0.04127 region, which means that the blocking of historical highs and the breakthrough of the trend line mark a real trend shift rather than a temporary correction. The failure condition for this view is to recover $0.0502 if trading volume increases.
Risks that traders should pay attention to
ZAMA saw a single candle reversal of more than 10% just after hitting a record high, which is a typical signal for a quick unwinding of crowded leveraged positions. Even when pledge contracts are considered, the concentration on the chain is still extremely high, and the activities of large households may further aggravate fluctuations in either direction. Any attempt to rebound should be cautious until $0.0502 is recovered and settled.
ZAMA Market Outlook: Analyst Views
Analysts believe it currently looks more like a classic wash after a record high than a confirmed trend reversal, as prices are still above the 100-day and 200-day EMA even after the decline. Still, the magnitude and speed of the reversal candle, coupled with the uptrend line being broken below, means that the $0.0502 retest is significant. The second-quarter Shielded report, due to be released on July 27, could also serve as a new catalyst, depending on how it reveals agreement adoption, independent of purely technical analysis.






















