
 Exchange Ranking
 Top Exchanges
 24h Volume Ranking
 Popularity Ranking
 Exchange BTC Balance
 Proof of Reserves
 Decentralized Exchanges
 Funding Rate
 Funding Heatmap
 Liquidation Data
 Max Pain
 Long/Short Ratio
 Whale L/S Ratio
 Binance/Okex/Huobi L/S
 Bitfinex Margin L/S
 ETF Tracker
 Solana ETF
 XRP ETF
 Hong Kong ETF
 Bitcoin Treasuries
 Crypto Reversal
 Ethereum Reserves
 HyperLiquid Wallet Analysis
 Hyperliquid Whale Watch
 Large Transactions
 On-chain Movement
 Bitcoin ROI
 Stablecoin Market Cap
 Options Analysis
 News
News Articles
 Economic Calendar
 Features
 Wallet
 Contract Calculator


 Security
 Collections
 Watchlist
 Following
Seven weeks ago, SpaceX completed the largest IPO in stock market history. Today, the stock price has fallen below the offering price paid by its IPO investors, and this chart tells the story more clearly than any headline.
$SPCX traded around $118.21 in early trading on Tuesday. That is about 44% below the record closing record of $211 set on June 16, about 12% below the $135 offering price, and two trading days after the stock hit a record low of $104.83. After tonight's close, the company will report its first quarterly earnings as a listed company, and its first internal lock-up period expires on Thursday.
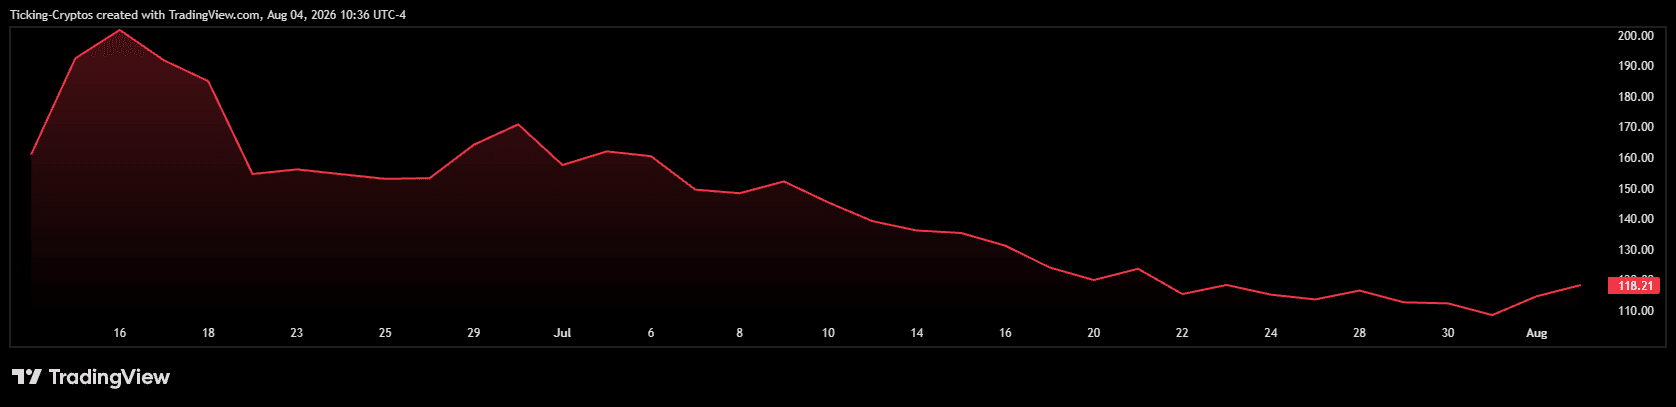 SPCX Share Price (USD)
Two events, two days apart, occurred on stocks that have been moving in the same direction for seven weeks.
What happened to the IPO?
By any traditional standard, the deal itself is a success.
SpaceX was priced at $135 per share on June 11 and began trading on Nasdaq on June 12, raising a total of $85.7 billion. The order book was more than tripled, with about $150 billion in demand chasing the financing, with about 30% of the quota reserved for retail investors, an unusually large proportion for a deal of this size. The retail portion was sold out before the pricing ended, and many investors who applied through Robinhood, Fidelity, SoFi, Schwab or E*TRADE received only partial rights issues or nothing.
The stock opened at $150 and closed at $160.95 on the first day. By June 16, it hit an intraday high of $225.64. At this time, the market's valuation of SpaceX is close to US$2.1 trillion.
One detail explains most of what followed: SpaceX issued less than 5% of its outstanding shares. Tiny rounds of circulation encounter great demand, which is a reliable recipe for soaring stock prices and an equally reliable recipe for what happens when rounds of circulation expand.
How to decompose the chart?
Judging from the chart since launch, the trend can be divided into five different stages.
In the first stage, listings rose (June 12 to 16). The stock price rose above the $200 line in four trading days from its first-day close of $161. The rise of nearly 25% in a week was based on scarcity rather than fundamentals, as there were no public results to trade at the time.
Second stage, first correction (June 17 - 22). The chart fell from about $190 to about $155 in three trading days before flattening out. This is the point where the initial scarcity premium recedes, and the trend during this period does not look like normal profit-taking, but a downward gap in the trend structure.
In the third stage, the failed index rebounded (June 23 to July 7). Shares rebounded to about $171 around June 30, driven by expectations of inclusion in the Nasdaq 100 index, which officially took effect on July 7, forcing about $4.3 billion in price-insensitive buying to flood the stock. The rebound peaked before the event and subsided as the event occurred. Textbook-style "buy rumors, sell news". Anyone who bought an index story for $171 lost 10% in a week.
The fourth stage, grinding (July 8 to 31). This is a technically important part. 23 trading days of lower highs and lower lows, with little to no rebound: $152, then $140, then $127, then $116, then $108.37 on July 31. The IPO price fell below July 15, when the SPCX intraday low fell to $132.15. Such orderly trends are usually position corrections rather than panic.
Phase 5, reversal (August 1 to 4). The stock hit US$104.83 in intraday trading on August 3 and then closed at US$114.53, rising 5.68% on the day and up another 3%. It was the first higher low on the chart in seven weeks.
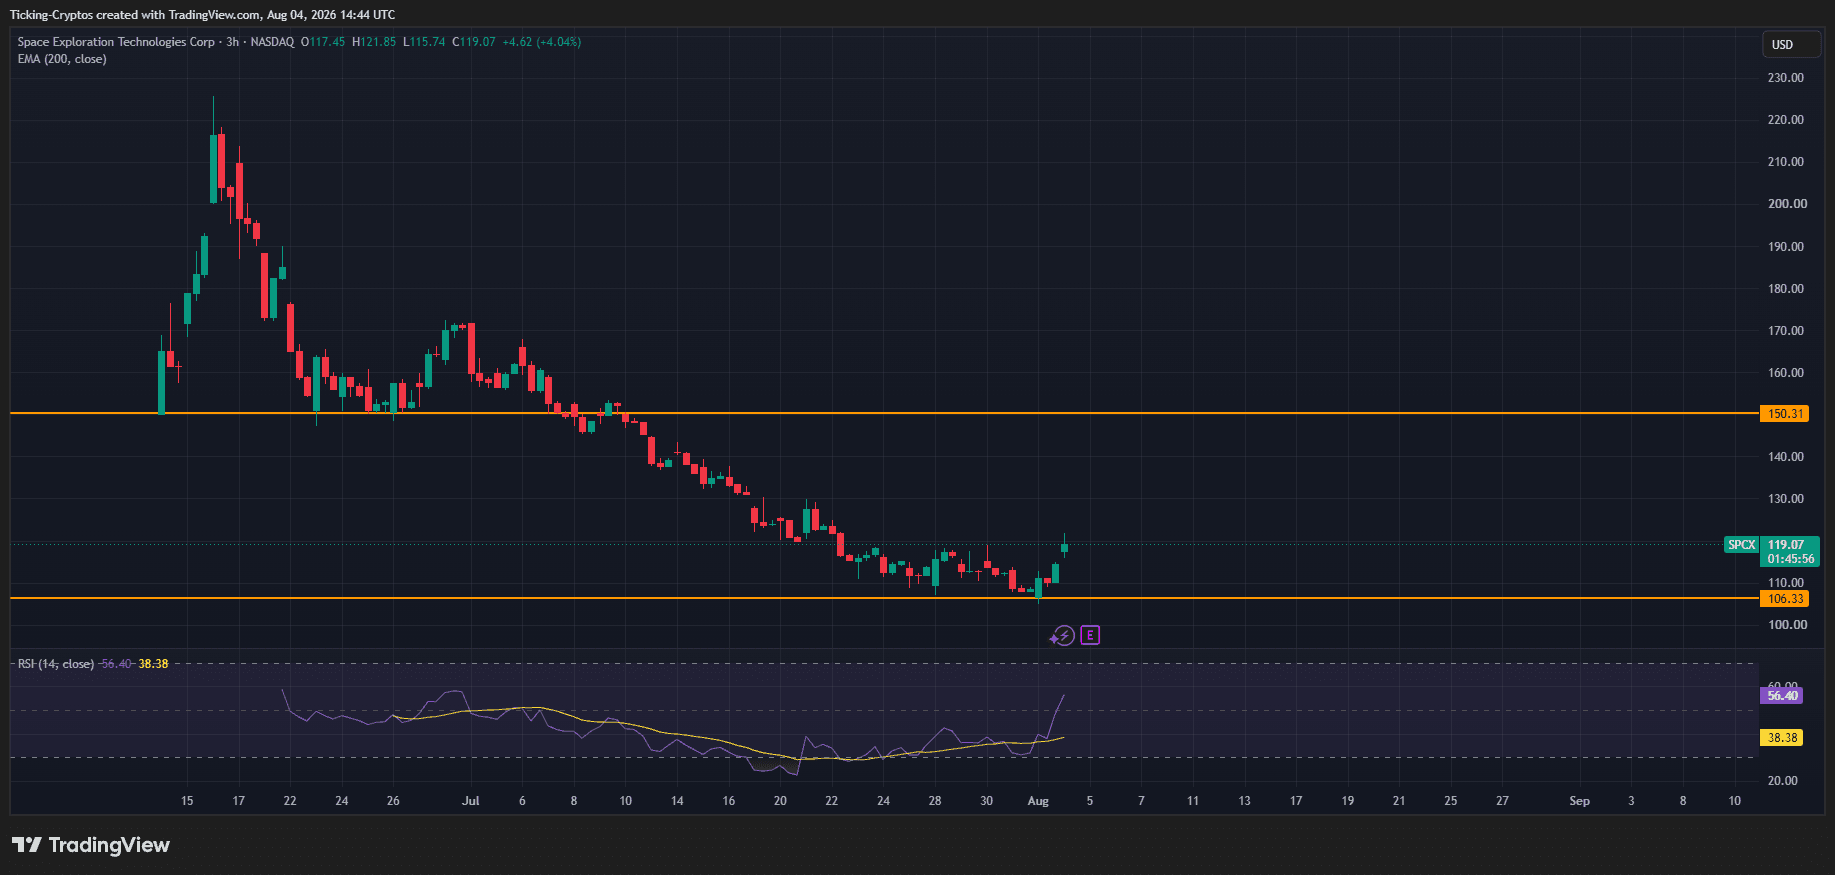 An inverted candle line after a 50% retracement does not mean that the trend has changed. This is the oversold performance of a stock when faced with two binary events.
Why did stock prices fall so deeply?
Four overlapping pressures, only one of which is related to the business itself.
The circulation plate expanded. The first lock-up period expired on August 6, releasing approximately 911.5 million shares, worth nearly $123 billion at recent prices. This figure exceeds the entire current open circulation order. And this is only the first part of the step-by-step lifting: five other smaller lifting (about 7% each time) will take place on the 70th, 90th, 105th, 120th and 135th days after listing, and another 28% will be lifted after the third-quarter results are announced. Supply will continue until December.
Short trade. SPCX became the most short new stock on Wall Street, with short positions accounting for about 28% of the circulation. S3 Partners attributed the accumulation to weak prices and upcoming lock-in periods, which is a position story rather than a fundamental argument.
Funding issues. Morgan Stanley sets SpaceX's capital requirements at $672 billion and does not expect to generate positive cash flow until 2035. The company lost approximately US$4.9 billion in 2025 and approximately US$4.3 billion in the first quarter of 2026 alone.
Valuation multiple. Even after the correction, SPCX's P/E ratio is still close to 49 times expected revenue. In comparison, Tesla's P/E ratio is about 15 times. Morningstar's view is that this valuation means investors will have to wait decades before profits can catch up with current prices.
What should tonight's earnings report show?
The consensus market expects second-quarter revenue to be approximately $6.8 to $6.9 billion and a loss per share of approximately $0.23, but analyst forecasts range from a loss per share of $1.26 to a profit of $0.33. This range tells you that the market actually knows very little.
Three numbers are crucial.
Star Chain. The connectivity division generated revenue of US$11.39 billion in 2025, accounting for approximately 61% of total revenue, and is the only profitable division with revenue of US$4.42 billion. As of June, there were more than 12 million subscribers, served by a constellation of more than 10200 satellites. Star Chain revenue in the second quarter is expected to be close to US$3.83 billion. Morningstar expects user growth to slow to 93% this year from 229% in 2025, so net increases in users and average revenue per user are more important than total revenue. SpaceX raised its prices in June and increased its monthly terminal fee by $10, which should reflect here.
AI expenditures. The division generated revenue of $818 million in the first quarter. After xAI changed its name to SpaceXAI on July 7 and acquired Cursor, the question was simple: Is Starlink's cash flow funding an AI business that can grow to a $1.4 trillion valuation, or is it subsidizing a business that cannot do this?
Starship launch rhythm. In July, 20 Star Chain V3 satellites were deployed on the 13th flight. What investors want is a timetable for regularly operating launches, not another test plan.
Where are the key price points?
On the chart, immediate resistance is at $123, the point where the decline accelerated in July. On top of that,$150 is the next meaningful platform and roughly where the trend will break in the second phase.
Below,$105 is now the reference low, while $100 is the integer level, which could attract attention if it breaks below. The $175.50 price is worth understanding for different reasons: If SPCX trades at a price higher than 30% of the IPO price on five of any ten trading days, another 10% of the restricted shares will be lifted early. At $118, this trigger is far from being met.
Analysts 'stance is clearly out of touch with stock price movements. There are 28 analysts covering the stock, 27 of whom give a buy rating, with a 12-month average price target of $236.71, and forecasts ranging from $62 to $800. Needham raised its price target to $250 in mid-July, the same week the stock fell below its IPO price. Phillip Securities gave its first sell rating on July 31. Ark Invest bought $16.6 million during the decline.
What is the realistic interpretation here?
The current situation is extremely clear, which is rare and deserves a clear explanation.
If the financial report shows an expansion in Star Chain profit margins and management gives credible capital expenditure guidance, then the 50% correction will seem excessive, and the short covering of 28% of the circulation will add fuel, and $123 and $150 will be targets again. If the data is weak or guidance is vague, Thursday's lock-up period will no longer be a planned event and will become a supply issue in a market that has struggled to digest the stock since June.
The broader lesson has nothing to do with rockets. Prices generated by orders below 5% in circulation reflect scarcity rather than consensus. Every holder who buys above $150 is buying a number created by the circulation order. This mechanism is currently being reversed in accordance with a plan that lasts until December, and no financial report can change this.






















