Exchange Ranking
 Top Exchanges
 24h Volume Ranking
 Popularity Ranking
 Exchange BTC Balance
 Proof of Reserves
 Decentralized Exchanges
 Funding Rate
 Funding Heatmap
 Liquidation Data
 Max Pain
 Long/Short Ratio
 Whale L/S Ratio
 Binance/Okex/Huobi L/S
 Bitfinex Margin L/S
 ETF Tracker
 Solana ETF
 XRP ETF
 Hong Kong ETF
 Bitcoin Treasuries
 Crypto Reversal
 Ethereum Reserves
 HyperLiquid Wallet Analysis
 Hyperliquid Whale Watch
 Large Transactions
 On-chain Movement
 Bitcoin ROI
 Stablecoin Market Cap
 Options Analysis
 News
News Articles
 Economic Calendar
 Features
 Wallet
 Contract Calculator


 Security
 Collections
 Watchlist
 Following
 KAS
KAS  SOL
SOL Cryptocurrency market comparison: Why is Kaspa still defeated by Solana?
Kaspa cryptocurrency has most of the characteristics that investors seek after: a proof-of-work algorithm, scarcity, and an expanding first-layer network. However, despite these positive characteristics, Solana's market value is more favored. The data clearly reflects the gap: Kaspa's market value is approximately $735 million, compared with Solana's approximately $44 billion, a nearly 60-fold difference. Solana also has deeper mobility, more applications, a more active DeFi ecosystem, and a larger user and developer base. So, what is Kaspa missing?
Why is Kaspa, which coexists with speed and scarcity, still insufficient?
Kaspa's reputation is based on significantly improving the speed of the proof-of-work network. Its emission model also gives a strong argument for scarcity to KAS tokens. According to the BSCN, about 96% of Kaspa's largest supply of 28.7 billion pieces has been mined, and new emissions decline through a smooth monthly curve rather than the traditional halving method.
Kaspa has no halving mechanism. Most proof-of-work chains halve block rewards in an instant, creating a sudden income cliff for miners and a planned impact on the market. Kaspa reduces emissions through a smooth monthly curve.
The problem is demand. Scarcity makes more sense only when people truly need an asset. Kaspa's market capitalisation data suggests that its network size is between US$700 million and US$735 million, which means that relatively moderate capital flows can have a significant impact on KAS prices. 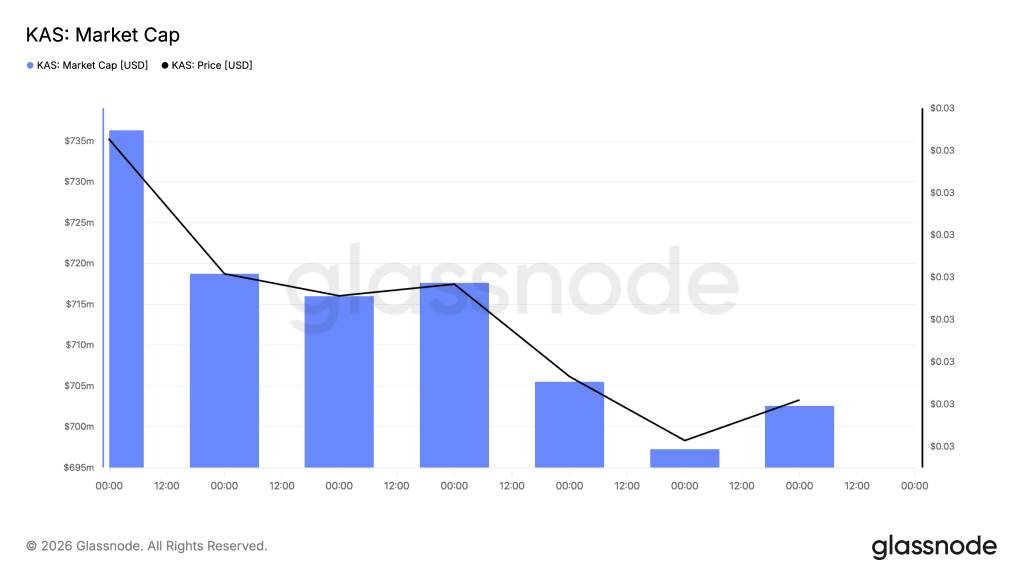
Source: Glassnode
Solana is on a completely different scale. Its market value is approximately US$43.5 billion to US$44.4 billion, and SOL's price fluctuation range is much smaller than that of KAS. During the period under review, KAS's market value fluctuated by approximately 5%, while SOL's was only approximately 1%. 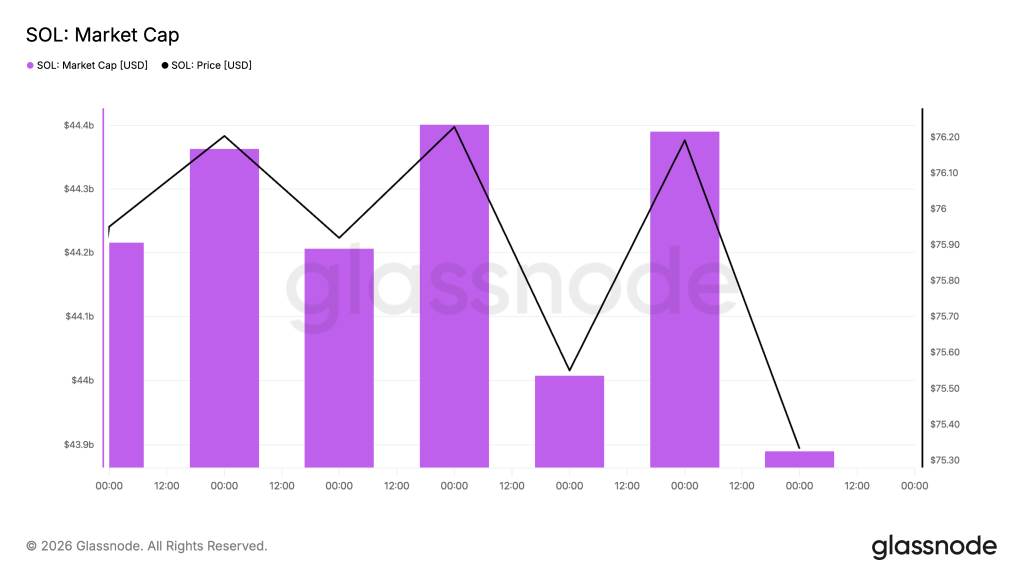
Source: Glassnode
Toccata upgrade has not fully fulfilled user expectations
Kaspa's Toccata upgrade is an important step. The upgrade, which was activated on June 30, 2026, introduces smart contract features, native KRC-20 tokens and Covenant support, effectively giving Kaspa programmable layer of network capabilities. But technology requires users. The market reaction provides a good example: KAS prices fell nearly 8% within hours of the upgrade, indicating that investors did not immediately place a higher valuation on the new feature.
This is where Solana has a huge advantage. Its ecosystem already includes DeFi platforms, stablecoins, memes, trading applications and other products that can generate activity and liquidity. Kaspa is still working to transform its technological capabilities into an ecosystem large enough to create the same network effects.
Whale data is another problem for Kaspa
The KAS price chart does provide some encouraging signs. We looked at the trend chart of KAS/USDT, and the price fell from about US$0.036 in early August to about US$0.022, and then recovered to around US$0.02542. 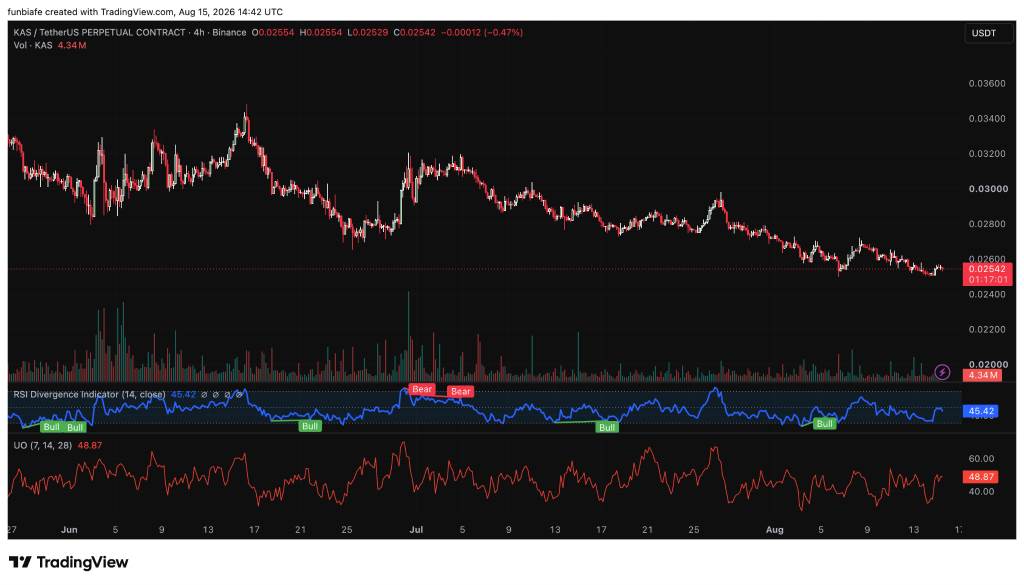
Source: TradingView
The RSI indicator showed three bullish divergence signals, which showed that while prices hit new lows, the indicator formed higher lows. This may indicate that selling pressure is weakening. However, the Ultimate Oscillator is at 48.87, which means that KAS still needs to recover 50 levels to confirm stronger momentum.
There is a major warning in the whale data chart shared by KaspaDaily. Kaspa's 30-day net whale flow was-224.32 million KAS, compared to a 30-day average of-154.59 million and a 90-day average of-75.27 million.
Simply put, big players are selling at a more aggressive pace than the long-term average. This makes KAS's price trend seem less convincing. A breakthrough of US$0.026 may open the way to US$0.028 -0.030, but a loss of US$0.022 support may expose a risk of US$0.020.
Solana gives users more reasons to stay
Solana's advantages stem from the ecosystem built around SOL, not just the underlying technology. We looked at the SOL/USDT chart and the price was around $75.46. SOL has established a trend in a range of approximately $68 to $84, with $80 and $84 being important resistance levels. Its ultimate oscillator is at 50.34, indicating that the instant kinetic energy of SOL is slightly stronger than that of KAS. 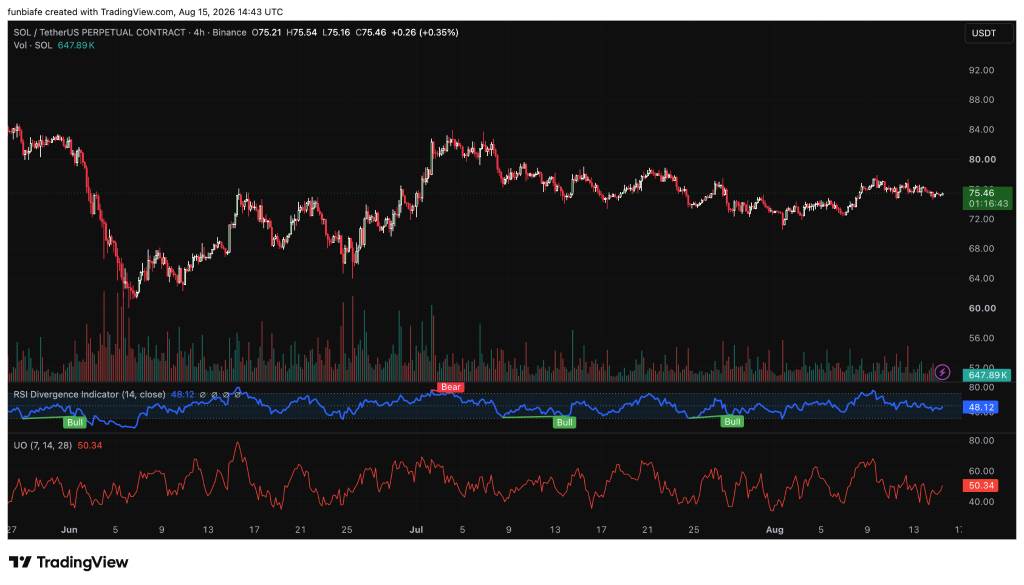
Source: TradingView
Solana has several potential catalysts in the future. Applications for spot SOL ETFs may provide a way for institutions to invest in the asset, while the Alpenglow upgrade is designed to improve final certainty and network efficiency. Proposals to reduce SOL inflation could also improve its supply-side economics over time. 
However, risks also exist. According to Cointelegraph, a Solana company generated revenue of $2.5 million in the second quarter of 2026, mainly from 31,200 SOL pledge awards, but still recorded a net loss of $30.3 million. Therefore, a large ecosystem does not mean that every business built around it will be profitable.
Kaspa needs practical applications, not just better technology
This ultimately explains why the market currently prefers Solana. Kaspa has speed, proof-of-work security and impressive scarcity characteristics. Its technology provides a solid foundation, but the network still needs more applications, developers, users and mobility. Solana already has these elements on a large scale. The next big test for Kaspa will be whether Toccata and the KRC-20 can transform their technology into real economic activity. Until this is achieved, KAS prices may still be traded as smaller, riskier assets, even if the remaining supply is limited. Solana has transformed technology into an ecosystem, and Kaspa now needs to do the same.
FAQs
Is Kaspa faster than Solana? 
Kaspa aims to provide very fast proof-of-work transactions, giving it a strong technical advantage in the PoW space. However, Solana combines high performance with a larger application and mobility ecosystem.
Can Kaspa surpass Solana?
Kaspa requires significant growth in users, developers, applications, liquidity and trading activity to close the current valuation gap. Its smaller market cap provides greater percentage upside potential, but also makes KAS price more volatile.