Exchange Ranking
 Top Exchanges
 24h Volume Ranking
 Popularity Ranking
 Exchange BTC Balance
 Proof of Reserves
 Decentralized Exchanges
 Funding Rate
 Funding Heatmap
 Liquidation Data
 Max Pain
 Long/Short Ratio
 Whale L/S Ratio
 Binance/Okex/Huobi L/S
 Bitfinex Margin L/S
 ETF Tracker
 Solana ETF
 XRP ETF
 Hong Kong ETF
 Bitcoin Treasuries
 Crypto Reversal
 Ethereum Reserves
 HyperLiquid Wallet Analysis
 Hyperliquid Whale Watch
 Large Transactions
 On-chain Movement
 Bitcoin ROI
 Stablecoin Market Cap
 Options Analysis
 News
News Articles
 Economic Calendar
 Features
 Wallet
 Contract Calculator


 Security
 Collections
 Watchlist
 Following
 BTC
BTC Key Points
Bitcoin (BTC) price exceeded US$79,000, and forced liquidation of short positions accelerated.
BTC cleared previous resistance, while supply on the upper chain remained scarce.
CryptoQuant's bull market score returns to the bullish range above 60.
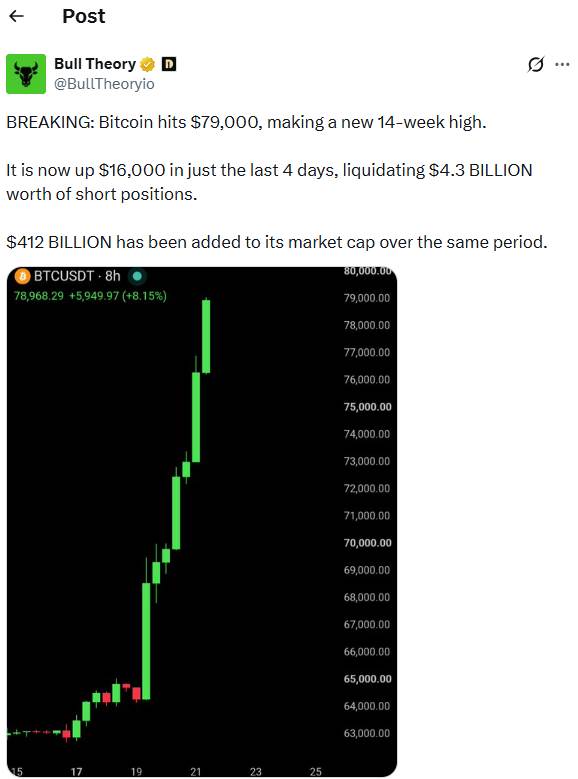
Bitcoin prices exceeded US$79,000 on August 21, continuing a four-day rebound. CoinMarketCap data showed that Bitcoin then traded around $77,000, down slightly from the intraday high. The breakthrough allowed BTC to break through multiple resistance levels formed during previous declines, while leveraging short positions were forced to close as spot demand improved.
Short closings push bitcoin prices up
CoinMarketCap data showed that BTC prices were close to US$77,000 on August 21, with an increase of about 7% in 24 hours, and trading volume exceeded US$70 billion. Historical data shows that Bitcoin was around US$62,819 on August 16, and then rose to above US$69,000 on August 19, continuing its upward trend.
This trend marks a sharp reversal after weeks of weakening market structures. Bull Theory pointed out that Bitcoin rose by about $14,000 from about $62,700 in the rebound. Market analysts also attributed some of the acceleration of the rally to short liquidations, estimating that traders lost approximately $4 billion in four days due to short positions.
Derivatives data also confirm the phenomenon of large-scale forced buying. CoinGlass data shows that the bitcoin clearing amount reached US$865.38 million in the most recent trading session, of which short positions accounted for US$742.28 million. When exchanges liquidate bearish leveraged positions, forced short liquidations trigger additional market purchases.
Bitcoin (BTC) prices break through key technical resistance
That Martini Guy said that BTC had broken through resistance near $70,500 before hitting around $75,743. He pointed out that the previous resistance level is now the next area buyers need to defend.
Bitcoin price rebound
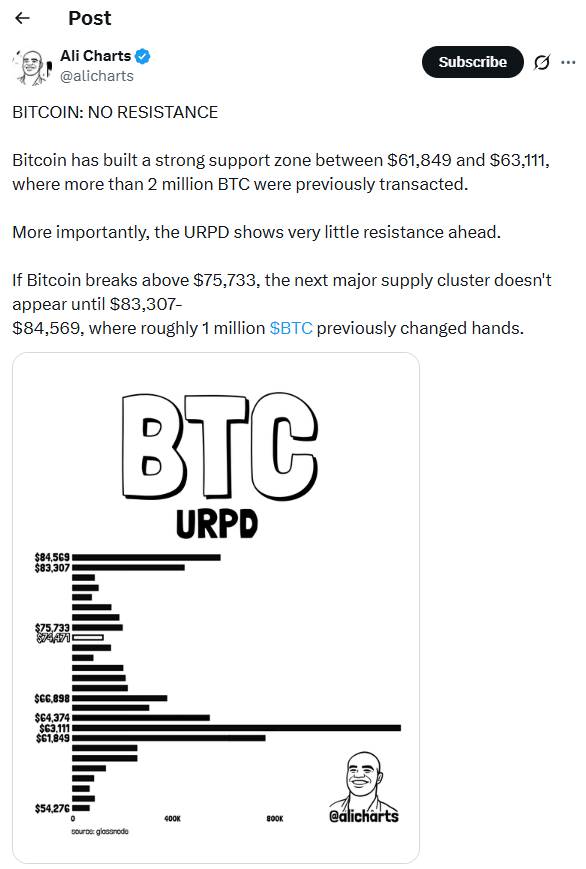
This structure places Bitcoin above the previously restricted upside. However, maintaining the breakout remains necessary until traders regard the $70,500 as confirmed support. On-chain analyst Ali Martinez found another technical threshold just above $75,700. His analysis used unspent transaction output realization price distribution data to locate historical bitcoin transaction clusters.
Bitcoin (BTC) Price Analysis
Martinez said more than 2 million BTC units were previously traded between $61,849 and $63,111. This transaction concentration forms a large on-chain support area below the current price. His data shows that historical supply above the breakthrough area is relatively sparse. The next larger supply cluster appears between US$83,307 and US$84,569. Crypto Patel pointed out that $82,800 is another level that needs confirmation. The trader believes that maintaining above this level could expose the psychological barrier of $100,000. He also found a fair value gap between $65,000 and $69,000 below current prices. Therefore, a break below this gap will weaken the current breakthrough structure.
At the same time, investors should note that this article provides market analysis based on technical indicators and does not constitute investment or financial advice. The price targets and levels discussed may not be achievable because the cryptocurrency market is highly volatile and influenced by multiple factors. Investors should independently assess risks and seek professional advice where appropriate.
BTC prices gain on-chain support
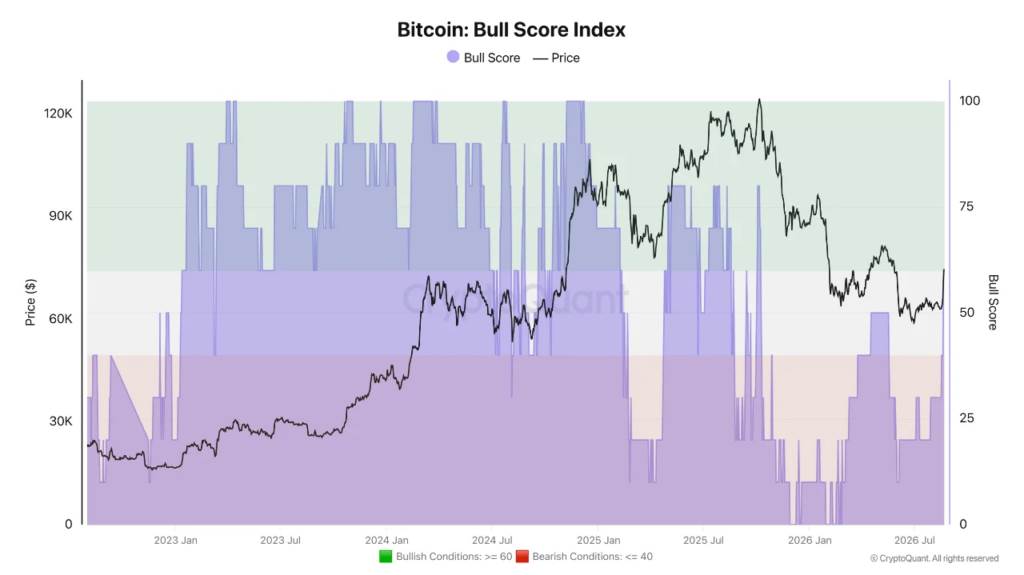
CryptoQuant analyst Darkfost reported that Bitcoin's bull market score exceeded 60 on August 21. The reading marks the first time since October 2025 that it has returned to bullish territory.
BTC Bull Market Rating Index
CryptoQuant's indicators combine multiple market indicators to classify the overall situation of Bitcoin. Darkfost said six of its ten underlying indicators have turned positive. These components include increased demand, stable currency liquidity and trader realization of prices. This combination suggests that the rally has support beyond short liquidations. Darkfost also pointed to an important historical contrast: Bitcoin climbed above $82,000 in May, but did not push the bull market score into bullish territory. As a result, the latest trend shows a broader improvement in the indicators tracked by CryptoQuant. However, the researchers said the score must remain above 60. This difference is important because the liquidation-driven rally may weaken after forced buying fades. Continued spot demand will provide stronger evidence that buyers will remain active thereafter. CoinMarketCap data shows that the next immediate test is near the recent intraday high of $77,000. Martinez's on-chain analysis puts large supply resistance at a level between $83,307 and $84,569. Continued breakthroughs in the region will reduce historical supply resistance nearby. Losing $70,500 would put pressure on the breakthrough structure identified by That Martini Guy.