Exchange Ranking
 Top Exchanges
 24h Volume Ranking
 Popularity Ranking
 Exchange BTC Balance
 Proof of Reserves
 Decentralized Exchanges
 Funding Rate
 Funding Heatmap
 Liquidation Data
 Max Pain
 Long/Short Ratio
 Whale L/S Ratio
 Binance/Okex/Huobi L/S
 Bitfinex Margin L/S
 ETF Tracker
 Solana ETF
 XRP ETF
 Hong Kong ETF
 Bitcoin Treasuries
 Crypto Reversal
 Ethereum Reserves
 HyperLiquid Wallet Analysis
 Hyperliquid Whale Watch
 Large Transactions
 On-chain Movement
 Bitcoin ROI
 Stablecoin Market Cap
 Options Analysis
 News
News Articles
 Economic Calendar
 Features
 Wallet
 Contract Calculator


 Security
 Collections
 Watchlist
 Following
 ADA
ADA  BTC
BTC  DOGE
DOGE  ETH
ETH  XRP
XRP  ZEC
ZEC Zcash ushered in a high moment: it exceeded US$975 in a single week, and the launch of a spot ETF boosted market sentiment.
Zcash (ZEC) has performed well recently, with its price soaring to more than US$975 in a single trading session, following the overall rebound of the entire cryptocurrency market, pushing the total market value of crypto its highest level in seven months. As the New York Stock Exchange's Arca sector has just launched the Zcash spot ETF, traders have begun to pay attention to whether its next target price is US$1,000. This article's Zcash 2026 price forecast will explore whether there is still room for this rally and what may hinder its rise.
Market data as of 9:41 am on September 4, 2026 (Indian Standard Time IST).
Today's Zcash price forecast: Market Overview
Indicator Value Price $949.958 24-hour Change +15% Market Value $15.97 billion Fully Diluted Valuation (FDV)$19.9 billion 24-hour Trading Volume $1.22 billion Trading Volume/Market Value Ratio (24h)7.68% Total Supply 16.85 million Maximum Supply 21 million Circulation Supply 16.85 million Data Source: CoinMarketCap, as of 9:41 am on September 4, 2026 (IST Indian Standard Time). Data from other tracking sites may differ slightly.
Why did Zcash rise sharply? The total market value of the crypto market hits a seven-month high
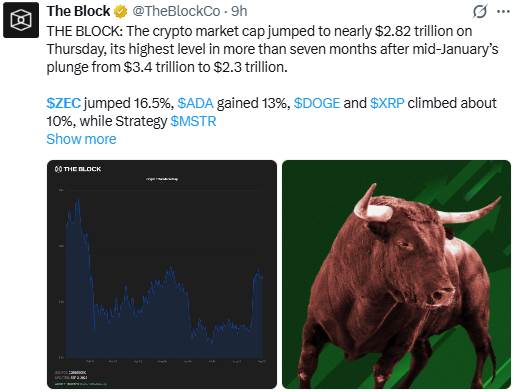 A post posted by The Block noted that the total market value of the crypto market jumped to nearly $2.82 trillion on Thursday, the highest level in more than seven months since plunging from $3.4 trillion to $2.3 trillion in mid-January. ZEC led the gains, with a gain of 16.5%, ahead of ADA's 13% gain and DOGE and XRP's gains of about 10%. CoinGabbar cannot independently verify these numbers unless they are confirmed outside of what was shared in the post.
 Zcash ETF 2026: Grayscale listing boosts gains
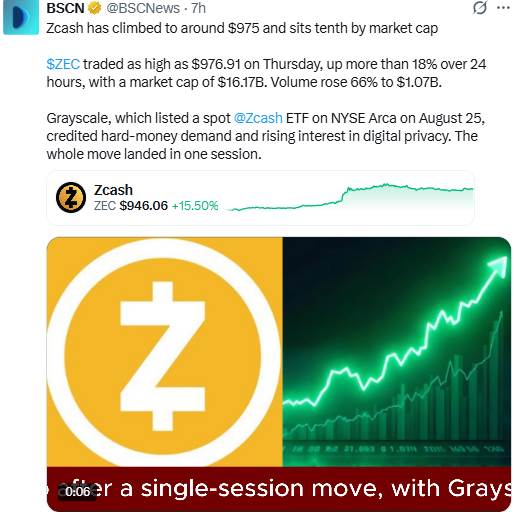
A post posted by the BSCN reported that $ZEC traded as high as $976.91 on Thursday, rising more than 18% in 24 hours, and trading volume rose 66% to $1.07 billion. The post attributed the trend to Grayscale's $Zcash spot ETF, which was launched on NYSE Arca on August 25, as well as growing demand for hard currency and growing interest in digital privacy. CoinGabbar cannot independently verify these numbers unless they are confirmed outside of what was shared in the post.
Zcash vs Bitcoin Investment Case 2026: Which is the better buying option?
Bitcoin's price today was US$81,001.10, up 4.21% in 24 hours. It remains the largest and most trusted crypto asset, with the most liquidity and the largest institutional investor support.$ Zcash is different from Bitcoin. It is much smaller, offers optional privacy features, and has been boosted by the launch of new spot ETFs. The smaller size means that ZEC fluctuates faster in both directions than Bitcoin, with greater gains and greater losses. Anyone looking at the latest bitcoin price forecasts will notice a huge difference in the movements of these two assets. Compared to Monero, another privacy coin, Zcash keeps privacy features optional rather than mandatory, making it easier for products like the new ETF to obtain approval. There are no clear winners here, it really depends on how much risk you can take, which does not constitute investment advice.
ZEC Price Forecast Chart: Technical Analysis
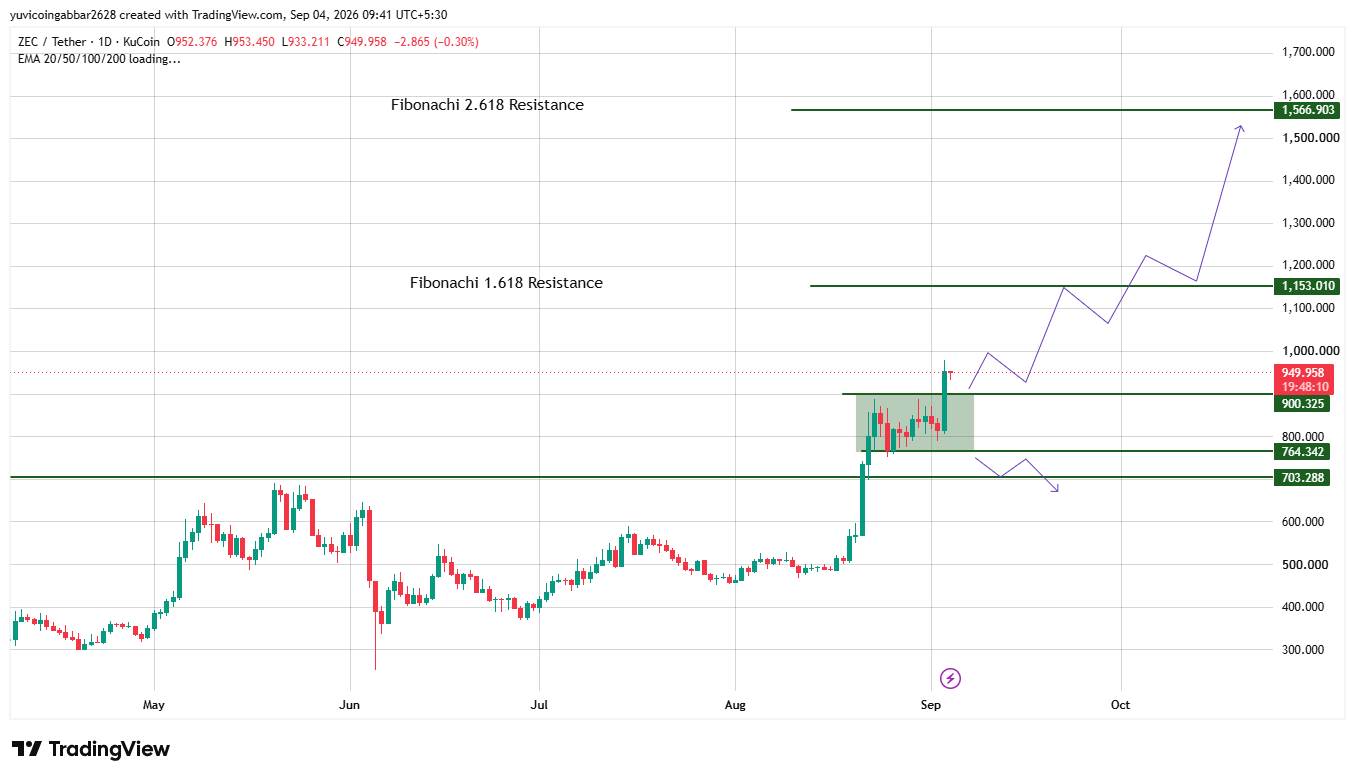
Trading Pair: ZEC/USDT ·Exchange: KuCoin ·Market: Spot (cryptocurrency)·Timeframe: Daily (1D) ·Source: TradingView ·Timestamp: September 4, 2026 09:41 UTC+5:30
ZEC trading price at US$949.958, the daily candle chart rose 15%, cooling slightly after a huge breakthrough candle chart pulled prices out of a multi-month consolidation range of approximately below US$700. That base below $703.288 and the consolidated range at the $900.325 level gave way to a strong rally that pushed ZEC to current levels.
Quick view: As long as ZEC remains above $900.325, the bullish trend remains unchanged; if the price closes above $1,153.010, the path opens to $1,566.903. A fall below $900.325 will put this setting in question.
 Price forecast: Key Level
Type Price Resistance Level 2 (Fibonacci 2.618)$1,566.903 Resistance Level 1 (Fibonacci 1.618)$1,153.010 Instant price reference $949.958 First confirmed support $900.325 Deeper support $764.342 Structural bottom $703.288 Zcash price forecast: Bull and Bear market scenarios
Bull market scenarios: Stay above the first confirmed support level of US$900.325 to maintain the integrity of the breakthrough pattern. A confirmation of a close above $1,153.010 would open a path to $1,566.903.
Bear market scenario: A break below US$900.325 will expose support at US$764.342, and loss of this support will re-test the structural bottom of US$703.288.
Can Zcash ($ZEC) reach US$1,566.903?
US$1,566.903 is the highest resistance level marked on the ZEC chart and is at the 2.618 Fibonacci extension level. To reach this level, ZEC first needs to clear $1,153.010, which is a multi-stage moving process rather than a single band.
Long-term outlook: US$2,000?
Some traders have already set their sights on the $2,000 mark. If ETF inflows continue, ZEC's long-term prospects may remain strong beyond this rally.
Zcash price forecast: expert opinion
According to CoinGabbar analysts, ZEC's breakthrough is accompanied by a rebound in the entire market and new demand from ETFs, which provides stronger background support than purely technical trends. $900.325 is the level to maintain structural integrity, and $1,153.010 is the next test point. After such a sharp rise, it is not uncommon for a pullback to the old consolidation range.
Disclaimer
This article is for reference only and does not constitute financial advice. The above levels and scenarios are derived from technical chart analysis and publicly available data at the time of writing. Cryptocurrency prices may fluctuate rapidly within a single trading session, so historical patterns cannot guarantee future trends. Readers should conduct their own research and weigh their risk tolerance before making any decisions based on the levels covered here.