Exchange Ranking
 Top Exchanges
 24h Volume Ranking
 Popularity Ranking
 Exchange BTC Balance
 Proof of Reserves
 Decentralized Exchanges
 Funding Rate
 Funding Heatmap
 Liquidation Data
 Max Pain
 Long/Short Ratio
 Whale L/S Ratio
 Binance/Okex/Huobi L/S
 Bitfinex Margin L/S
 ETF Tracker
 Solana ETF
 XRP ETF
 Hong Kong ETF
 Bitcoin Treasuries
 Crypto Reversal
 Ethereum Reserves
 HyperLiquid Wallet Analysis
 Hyperliquid Whale Watch
 Large Transactions
 On-chain Movement
 Bitcoin ROI
 Stablecoin Market Cap
 Options Analysis
 News
News Articles
 Economic Calendar
 Features
 Wallet
 Contract Calculator


 Security
 Collections
 Watchlist
 Following
 BTC
BTC  LINK
LINK Chainlink Price Forecast: Project Background and Market Status
Price forecasts for Chainlink usually start with a basic question: What is this project? Why is its tokens so important? Chainlink was launched in 2017 through an initial coin offering (ICO). The idea behind it is simple: connect smart contracts with real-world data that they cannot access on their own. This concept makes Chainlink one of the more mature components of the cryptocurrency infrastructure. Currently, the LINK token ranks 16th by market capitalisation. The current trading price of $LINK is US$11.89, up 6.2% in the past 24 hours. This puts Chainlink's market value at US$8.898 billion, far ahead of small altcoins that tend to dominate short-term hype cycles.
Indicator Value Price $11.89 24-Hour Price +6.2% 24-Hour Volatility Range $11.11-$11.95 Market Value $8.898B Fully Diluted Valuation $11.895B 24-Hour Trading Volume $496.216M Lock-in Total Value (TVL)$1.761B Circulation supply 748.1 million LINK Total supply 1 billion Maximum supply 1 billion Treasury holdings 562,535 Source: CoinGecko's LINK market value data, as of September 4, 2026. Data from different tracking sites may vary slightly.
Chainlink liquidation snapshot
Liquidation data showed that bears suffered larger losses as LINK rebounded over the past day. In the past hour,$5,240 was cleared, all from short positions, and no long clearing was recorded. During the four-hour time window, the total liquidation amount reached US$5,840, with US$261.45 for long positions and US$5,580 for short positions.
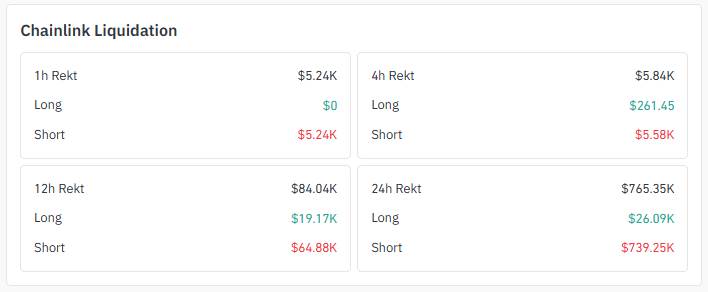 Data source: CoinGlass's liquidation data, the 12-hour time window as of September 4, 2026
tells a similar story: The total liquidation amount was US$84,040, of which short positions accounted for US$64 ,880 and long positions accounted for US$19,170. During the entire 24-hour period, the total liquidations totaled US$765,350, with short positions dominating the majority, reaching US$739,250, while long positions only US$26,090. This one-sided pattern suggests that breakout markets squeeze traders who trade bearish.
Chainlink Exchange Trading Volume
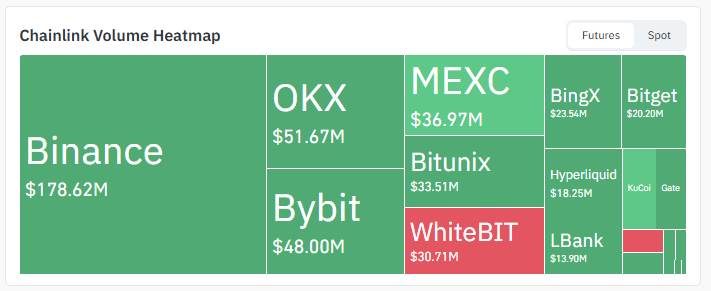
Link's futures trading activity is still concentrated on a few major exchanges. Binance led by a huge margin, with 24-hour futures trading volume reaching US$178.62 million, followed by OKX's US$51.67 million and Bybit's US$48 million.
 Data source: CoinGlass's VolumeHeatmap data, as of September 4, 2026
MEXC recorded $36.97 million, Bitunix reported $33.51 million, and WhiteBIT recorded $30.71 million. Smaller contributions came from $23.54 million from BingX,$20.2 million from Bitget,$18.25 million from Hyperliquid and $13.9 million from LBank, with the rest spread across KuCoin and Gate. Due to the high concentration on Binance, liquidity conditions there often set the tone for price discovery across the market.
Chainlink News
According to BSCN (@BSCNews) reported:
Bottomline cooperated with Chainlink to provide on-chain settlement services to 600 banks
 Data source: @BSCNews X account data, as of September 4, 2026
This development has increased Chainlink's growing influence in the institutional finance sector, with its oracle and interoperability infrastructure increasingly positioned as a bridge between traditional banking systems and blockchain settlements.
Why it matters: As a major SWIFT service provider, Bottomline is working with Chainlink to enable cross-chain and cross-border transactions across its network of more than 600 financial institutions. The integration uses the Chainlink Cross-Chain Interoperability Protocol (CCIP) and the Chainlink Runtime Environment (CRE) to connect traditional payment tracks to public and private blockchain networks, allowing member banks to settle for tokenized value through ISO 20022 messaging on a unified gateway.
Chainlink Price Forecast: Technical Analysis
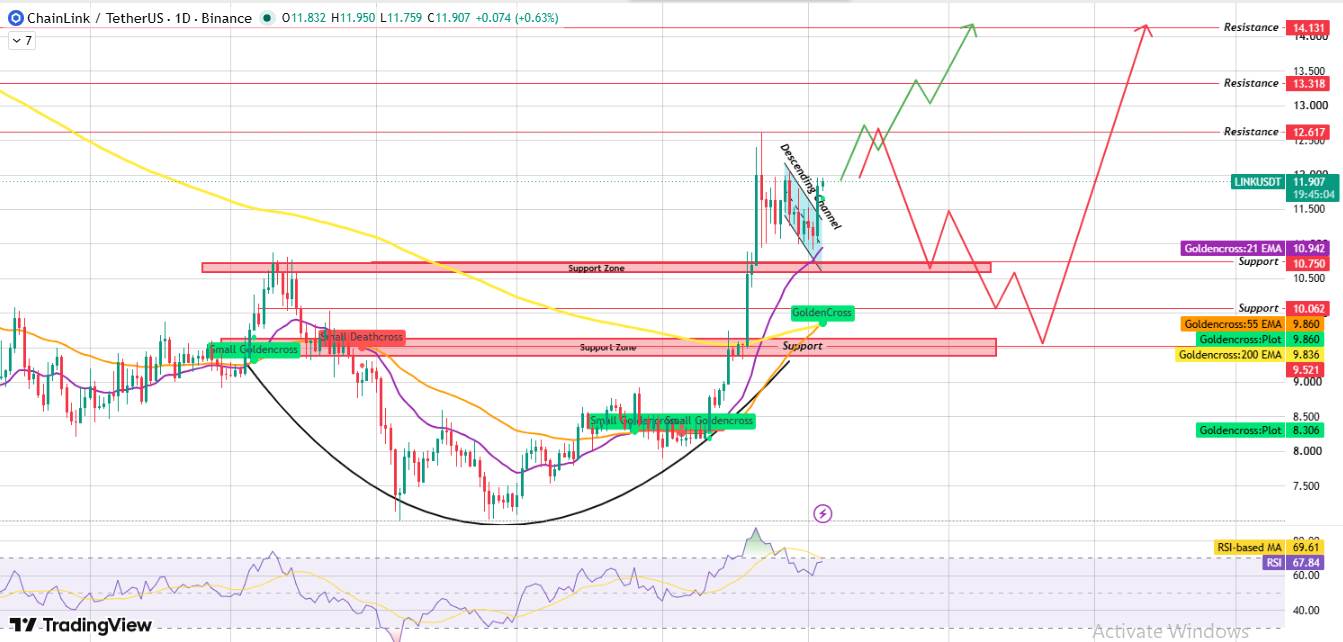
The daily LINK/USDT chart on Binance shows a round-bottomed structure that forms over a few weeks, with prices gradually bowing upward, and then breaking through the neckline of the pattern. The breakthrough drove prices up sharply before entering a short-term downward channel, a common pause after strong directional movements .
 Data source: TradingView chart, as of September 4, 2026
Since then,$LINK has broken through the upper boundary of the channel, a move that is accompanied by significantly higher trading volume than in previous trading days, which increases the credibility of the breakthrough.
Chainlink's daily candle chart is above the moving averages of all three key indices. A golden cross was also formed, with the 21 EMA returning to above the long-term moving average, strengthening the shift in the short-term structure.
Can LINK break through the $12.62 resistance level?
immediate hurdle sits at $12.617. A daily candle close above this level, ideally accompanied by volume that exceeds the recent average, would confirm the breakout and open the path toward $13.318 and, further out, $14.131.
If the price encounters a rejection at the resistance level of $12.617, the first area of concern during the decline is the support band of $10.750 - 10.942, which closely matches the 21 EMA. If there is no subsequent confirmation of a rebound and the daily line breaks below the zone, the focus will shift to US$10.062, then the US$9.836 - 9.860 range where the 55 and 200 EMA are grouped together.
The RSI reading is 67.84, with an average of 69.61, indicating that momentum is firmly leaning towards buyers, although it is gradually approaching overbought territory. This does not rule out the possibility of further gains, but it does mean a sharp correction could occur if buying pressure weakens near resistance.
Chainlink Support and Resistance Levels (Daily Chart)
Level Type Price Resistance 3$14.131 Resistance 2$13.318 Resistance 1$12.617 Support 1$10.750 Support 2$10.062 Support 3$9.521 Chainlink EMA Level (Daily Chart)
EMA Numeric Price Position 21 EMA$10.942 Price Above Trade 55 EMA$9.860 Price Above Trade 200 EMA$9.836 Price Above Trade LINK Price Forecast: Bullmarket, benchmark and bear market scenarios
Scenario set target for the bull market scenario daily closed above US$12.62, with strong volume confirmed at US$13.32, and extended target of US$14.13 The benchmark scenario price is trading in a consolidating range between the US$10.75 support band and the US$12.62 resistance level. No new breakthroughs The bear market scenario is blocked at the resistance level. The daily line then closed at $10.06 below the US$10.75 support level, falling further to the $9.86-$9.84 glossary
Rounded Bottom
A chart pattern in which prices gradually curve from a downward trend to an upward trend, usually marking a slow shift in market sentiment rather than a sudden reversal.
Neckline
marks the resistance level at the top of the round bottom or similar reversal pattern; a close above this level is usually considered a pattern confirmation.
Descending Channel
A short-term pattern formed by two parallel downwardly sloping lines usually reflects a pause or mild correction in a larger uptrend rather than a complete reversal.
EMA (exponential moving average)
A moving average that weights recent price data more than older data, making it respond to new price actions faster than a simple moving average.
Golden Cross
The situation where the short-term moving average crosses above the long-term moving average is often seen as an early signal of increased upward momentum.
Liquidation
Forced liquidation of leveraged futures positions when the loss-eroded trader's margin falls below the exchange's maintenance requirements.
RSI (Relative Strength Index)
A momentum indicator ranging from 0 to 100 that measures how fast and how far prices have moved recently and is often used to assess overbought or oversold conditions.
Chainlink versus Bitcoin
Link's rebound roughly tracks the price trend of Bitcoin during the same period, with both assets pushing higher. Bitcoin prices today are around $81,000. Its role as an anchor for market liquidity means that altcoins like LINK often see amplified fluctuations in the same direction. Chainlink's current breakthroughs are in line with this pattern, not in opposition to it. Any bitcoin price forecast pointing to room for further upside could maintain a favorable environment for LINK test resistance. On the other hand, a reversal of Bitcoin could pull LINK back into its support zone, regardless of Chainlink's own technical form.
Expert opinion
Market commentary surrounding Chainlink has increasingly focused on its expanding role in institutional and cross-border payment infrastructure, rather than just speculative trading activity. Analysts in the field of tracking oracles point out that partnerships to link Chainlink's CCIP and CRE technologies to established payment networks, such as the recent Bottomline collaboration, add a fundamental need that goes beyond relying solely on short-term chart models. Having said that, it is expected that the near-term price trend will still depend on whether $LINK can hold on to its 21EMA support level and clear resistance at $12.62, backed by strong trading volume.
Disclaimer
This document is for reference only and does not constitute financial advice. Cryptocurrency markets, including Chainlink (LINK), are extremely volatile and prices can fluctuate violently in either direction over a short period of time. The above bull, benchmark and bear market scenarios are technical forecasts based on available chart data and are not guarantees of future performance. There is a risk that LINK will not be able to reach any established levels, or in situations such as a broader market downturn, the decline may fall well below the support level in discussion. Readers should conduct their own research and consult a qualified financial adviser before making investment decisions.