Exchange Ranking
 Top Exchanges
 24h Volume Ranking
 Popularity Ranking
 Exchange BTC Balance
 Proof of Reserves
 Decentralized Exchanges
 Funding Rate
 Funding Heatmap
 Liquidation Data
 Max Pain
 Long/Short Ratio
 Whale L/S Ratio
 Binance/Okex/Huobi L/S
 Bitfinex Margin L/S
 ETF Tracker
 Solana ETF
 XRP ETF
 Hong Kong ETF
 Bitcoin Treasuries
 Crypto Reversal
 Ethereum Reserves
 HyperLiquid Wallet Analysis
 Hyperliquid Whale Watch
 Large Transactions
 On-chain Movement
 Bitcoin ROI
 Stablecoin Market Cap
 Options Analysis
 News
News Articles
 Economic Calendar
 Features
 Wallet
 Contract Calculator


 Security
 Collections
 Watchlist
 Following
 FF
FF FF Price Forecast: Falcon Finance breaks through long-term consolidation and attracts new attention from the market.
Falcon Finance (FF) breaks the long-term range volatility trading, and its price forecast is attracting more and more attention. The token has risen steadily over the past week, especially during the past day, when buying pressure has strengthened significantly. After several months of highs on the daily chart, FF currently appears to be testing a key resistance level, and traders are closely watching whether the market has room to expand or needs to be suspended first.
What is the current situation of FF?
According to DefiLlama, Falcon Finance's total locked value (TVL) is US$1.176 billion, FF's today price is US$0.15, market value is US$463.49 million, and a fully diluted valuation is US$1.476 billion.
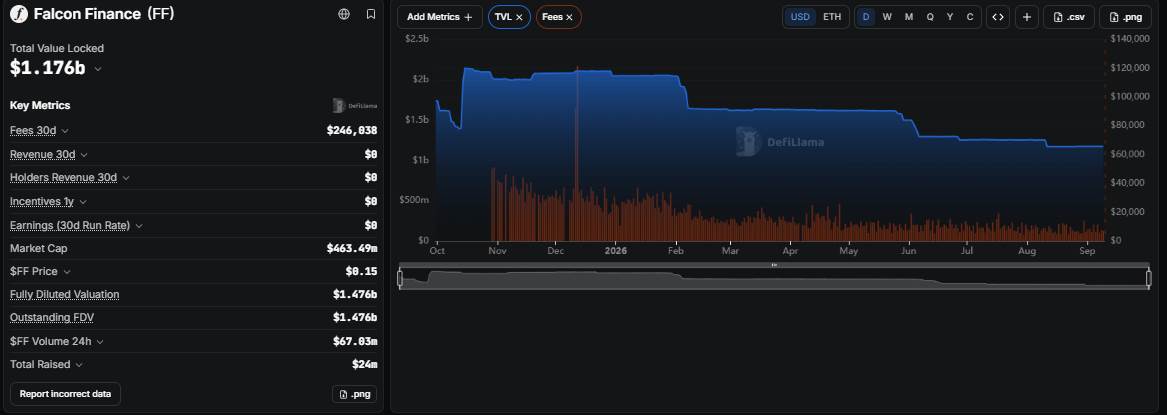 The agreement incurred fees of US$246,838 over a 30-day period, although revenue, holder income and incentives were all shown as US$0 over the same period. This is noteworthy because it contrasts with the strong decentralized finance (DeFi) protocol growth in TVL. The 24-hour transaction volume reached US$67.83 million, and the total financing amount was US$24 million.
CoinGlass data showed that the FF price was US$0.14731, up 23.15% in 24 hours, and the market value was US$462.6 million. The circulation supply is 3.14 billion pieces, and the total supply and maximum supply are both 10 billion pieces.
 24-hour futures volume was US$161.3 million, spot volume was US$40.79 million, and open interest value was US$169.77 million.
How has FF performed recently?
FF price analysis provided by CoinGlass showed strong momentum: a 23.13% increase in 24 hours and a 48.84% weekly increase. The 30-day increase was 133.13%, the 90-day increase was 92.17%, and the 180-day increase was 99.43%. Year-to-Date (YTD) rose 70.78%, although the token has still fallen 68.76% in the past year, and the two figures have remained consistent since launch, reflecting the token's relatively young market history.
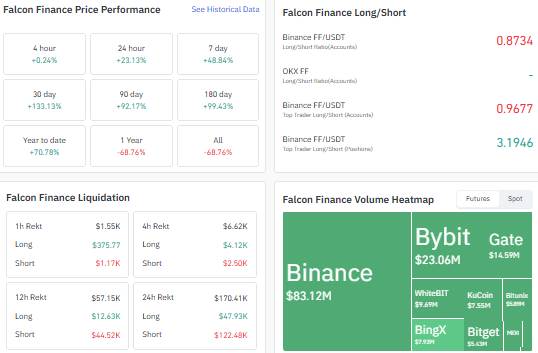 Despite the rebound, FF's long-short ratio shows some hesitation: Binance's account side ratio is 0.8734, while top traders are more inclined to go long, with the account side ratio being 0.9677 and the open side ratio being as high as 3.1946, indicating that large investors are more confident than small accounts. This is also reflected in the liquidation data: the amount of open positions within 24 hours was US$170,410, the short positions suffered a larger loss of US$122,480, while the long positions were US$47,930, and the squeeze on positions in the futures market is intensifying.
Binance led the way with volume of $83.12 million, followed by Bybit ($23.06 million) and Gate ($14.59 million).
FF What is the open position?
According to CoinGlass data, FF's open interest was valued at $169.77 million, climbing sharply as prices and 24-hour volume rose. This surge usually indicates new money entering, rather than just short covering, but if momentum stagnates near current resistance, it will increase exposure.
Falcon Finance Daily Chart: Technical Outlook
Daily Chart tracked through TradingView shows that after months of consolidation, prices have formed a clear pattern of high highs rising, gaining support around 0.06245 and breaking through the resistance level of 0.11822 during the rise.
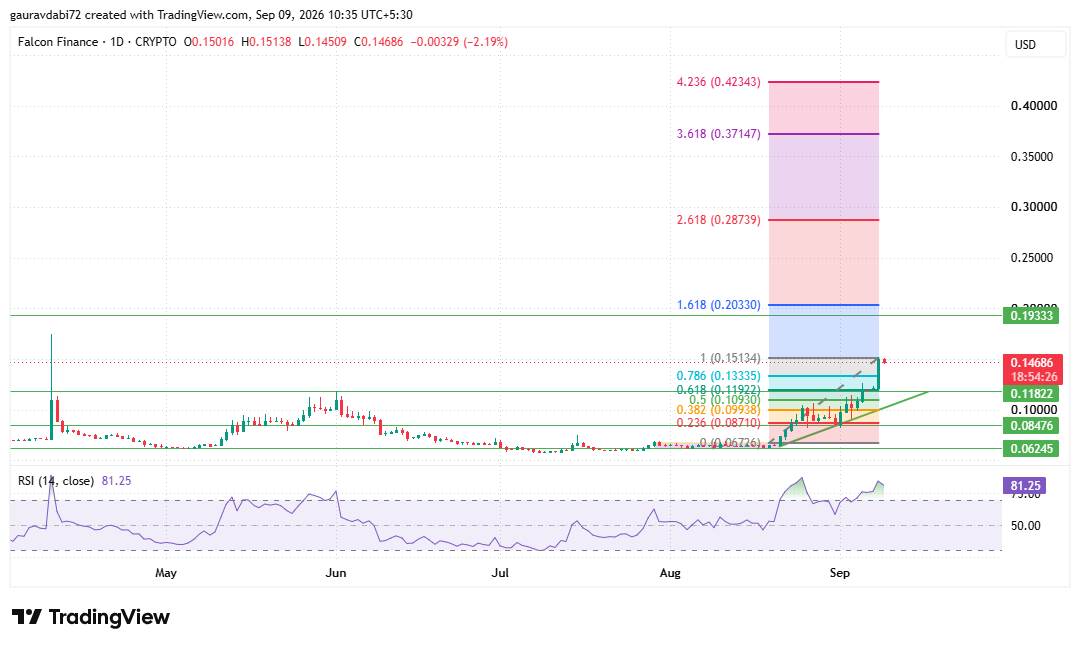 Currently, prices are testing the 0.15134 position of Fibonacci Extended Level 1. If prices trade above this level and hold firm, then the 0.19333 area will be the first area to focus on. At this point, the RSI indicator is 81.25, which is in a deeply overbought area, so even in a strong trend, it is not surprising that there are some pullbacks.
If FF breaks through and stays above 0.19333, the Fibonacci extension level sets the next target areas at 0.20330, 0.28739, 0.37147 and 0.42343, each area requiring continued buying to reach. This breakthrough has not yet been confirmed. If this level is rejected, 0.11822 will be the first support level to focus on, while 0.08476 and 0.06245 are deeper safety cushions.
FF Price Forecast: What is the next outlook?
Falcon Finance's price forecast outlook is biased towards a bullish one, provided that the broader high-rise structure is maintained, supported by growing open interest and strong trading volume. However, the fact that the RSI is above 80 and the tokens have fallen sharply from highs suggests that this looks more like a strong recovery than a confirmed new trend.
Breaking through and stabilizing 0.19333 would make 0.20330 and 0.28739 potential targets; if rejected, the price could fall back to around 0.11822.
What are the main risks faced by FF?
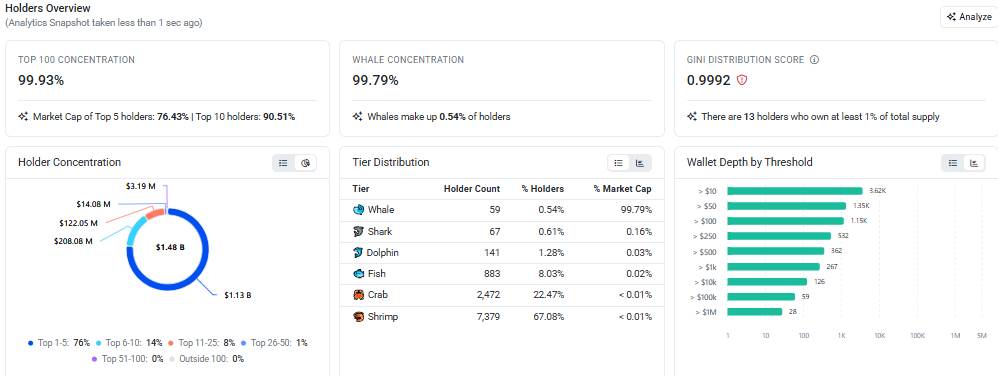
The concentration of holders here is also extremely extreme. The top 100 wallets control 99.93% of holder concentration, whales (only 0.54% of holders) hold 99.79% of the market value, and only 13 wallets have at least 1% of the supply. This is a real concentration risk among chain holders, which may lead to sharp price fluctuations.
 Although US$246,838 in fees were incurred in the past 30 days, the recorded revenue and holder income were zero, raising questions about the mechanism for generating agreement fees and the actual flow of these values. Combined with the overbought RSI indicator, this setting requires careful position size management.
Analyst Opinion
According to CoinGabbar analysts, the shift from integration to a true high-point lifting structure is a strong technical signal, but due to overstretched RSI indicators and extremely high concentration of holders, there is a real risk in chasing 0.19333 without confirmation.
Conclusion
FF has achieved a strong multi-week recovery, clearing previous resistance levels and is currently testing greater resistance at 0.19333. Whether it can move to 0.20330 and above depends on whether the area is breached, and the overbought daily RSI and extreme holder concentration remain the clearest reasons to remain cautious.
Disclaimer : This document is for information purposes only and does not constitute financial advice. The cryptocurrency market is extremely volatile and readers should conduct independent research before making any investment decisions.