Exchange Ranking
 Top Exchanges
 24h Volume Ranking
 Popularity Ranking
 Exchange BTC Balance
 Proof of Reserves
 Decentralized Exchanges
 Funding Rate
 Funding Heatmap
 Liquidation Data
 Max Pain
 Long/Short Ratio
 Whale L/S Ratio
 Binance/Okex/Huobi L/S
 Bitfinex Margin L/S
 ETF Tracker
 Solana ETF
 XRP ETF
 Hong Kong ETF
 Bitcoin Treasuries
 Crypto Reversal
 Ethereum Reserves
 HyperLiquid Wallet Analysis
 Hyperliquid Whale Watch
 Large Transactions
 On-chain Movement
 Bitcoin ROI
 Stablecoin Market Cap
 Options Analysis
 News
News Articles
 Economic Calendar
 Features
 Wallet
 Contract Calculator


 Security
 Collections
 Watchlist
 Following
 VET
VET VeChain (VET) fell more than 7% today and prices entered the downward channel.
VET fell more than 7% today, pulling prices into the downward channel that has formed since their rebound in early September. Trading volume also cooled, falling about 6% over the same period. The price is currently around $0.00746, right at the lower boundary of the channel and a clear overlap of support levels. This VeChain price forecast aims to test whether this support is solid or will give way to a deeper correction.
Market data as of September 15, 2026, based on charts with a timestamp of 01:16 (UTC).
Today's price forecast for VeChain: Market Overview
Indicator Value Price $0.0074557 Market Value $642.71M (-7.42%) Current market value $648.15M 24-hour trading volume $21.23M (-6.33%) Volume/market value ratio (24h)3.32% Fully diluted valuation (FDV)$648.15M Total supply 85.98B Maximum supply 86.71B Circulation supply 85.98B Source: CoinMarketCap data, as of September 15, 2026 13:16 IST. Data from other tracking sites may differ slightly.
VeChain Price Forecast Chart: Technical Analysis
Trading Pair: VET/USD ·Market: Spot·Timeframe: Daily (1D) ·Timestamp: September 15, 2026 04:16 UTC
The VET trading price is $0.0074557, trading in the downward channel formed after a sharp rebound in early September. The price is currently testing the lower boundary of the channel, which coincides with the support level of $0.0071633.
The key point is that to continue the trend, prices need to hold on to support and break through channel limits upwards.
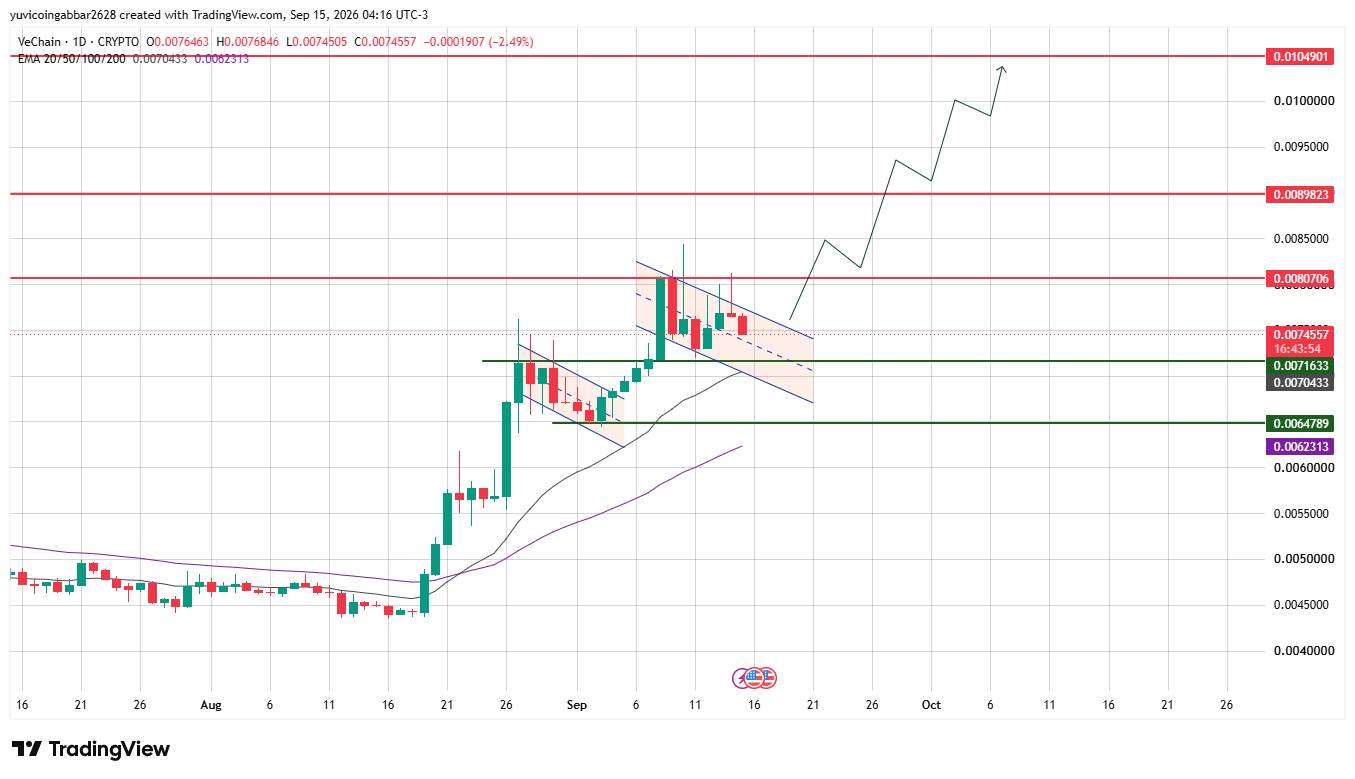 $VET关键观察水平:支撑与阻力展望 类型价格 阻力位3$0.0104901 阻力位2$0.0089823 阻力位1(最近)$0.0080706 即时价格参考$0.0074557 首个确认支撑位$0.0071633 深层支撑位$0.0064789 VeChain预测:牛市情景 vs 熊市情景
牛市情景:若从$0.0071633反弹并重新突破下行通道上方,将为价格向$0.0080706乃至$0.0089823攀升打开空间,前提是动能回归。
熊市情景:若收盘价低于$0.0071633,则将暴露靠近$0.0070433的EMA集群,随后触及$0.0064789的深层支撑,从而延长当前的通道跌破态势。
VeChain能否实现10倍增长?长期展望
若从今天的价格计算10倍涨幅,VET将接近$0.0746,市值将攀升至约64亿美元,远高于当前图表上的最高阻力位$0.0104901。这并非短期技术面设置;这是一个多年期的情景,需要持续的企业和供应链采用以推动实际需求,而不仅仅是从支撑位反弹。虽然可能在更长的时间范围内实现,但今天的图表或数据并未指向其即将发生。
$VET触发条件与失效场景
场景触发条件可能结果失效点Channel rallies from $0.0071633 to $0.0080706 Close below $0.0071633 Support remains above $0.0070433 Continue to consolidate near channel lows Close below $0.0070433 Support ruptures Close below $0.0070433 Slide towards $0.0064789 Recovering $0.0071633 VeChain Price Forecast: Can VET reach $0.0104901?
$0.0104901 is the highest resistance level marked on the chart. To achieve this goal, VET first needs to clear $0.0080706, then $0.0089823, which is a multi-stage process that requires today's callback to be completely reversed first.
VeChain 2026 Price Forecast: Expert Opinion
According to CoinGabbar analysts, today's decline has brought VET to a critical decision point, with channel support and marked demand areas both in the same area. The most important range for the next few trading sessions is $0.0071633 to $0.0080706.
Disclaimer
This document is for reference only and does not constitute financial advice. The above levels and scenarios are based on technical chart analysis and publicly available data at the time of writing. The crypto market can fluctuate violently within hours, so past patterns do not guarantee future results. Before taking any action, it is worth conducting independent research and considering your own risk tolerance.