
 Exchange Ranking
 Top Exchanges
 24h Volume Ranking
 Popularity Ranking
 Exchange BTC Balance
 Proof of Reserves
 Decentralized Exchanges
 Funding Rate
 Funding Heatmap
 Liquidation Data
 Max Pain
 Long/Short Ratio
 Whale L/S Ratio
 Binance/Okex/Huobi L/S
 Bitfinex Margin L/S
 ETF Tracker
 Solana ETF
 XRP ETF
 Hong Kong ETF
 Bitcoin Treasuries
 Crypto Reversal
 Ethereum Reserves
 HyperLiquid Wallet Analysis
 Hyperliquid Whale Watch
 Large Transactions
 On-chain Movement
 Bitcoin ROI
 Stablecoin Market Cap
 Options Analysis
 News
News Articles
 Economic Calendar
 Features
 Wallet
 Contract Calculator


 Security
 Collections
 Watchlist
 Following
 BTC
BTC  ETH
ETH According to data released by SoValue, the U.S. spot Bitcoin ETF recorded a net inflow of US$32.1 million on July 29. This performance ended four consecutive trading days of net outflows totaling more than US$500 million. At the same time, the Ethereum ETF suffered a wave of divestments: a single-day outflow of US$18.65 million. What does this differentiation mean? The complete analysis is as follows.
Brief overview
Bitcoin ETF recorded a net inflow of US$32.1 million.
Ethereum ETF experienced a net outflow of US$32.9 million.
Despite this, Ethereum maintained its advantage throughout July.
Fear and Greed Index is still in the fear range, at 28.
ETFs resume net inflows, but Bitcoin prices fall
SoValue and Farside report the same fact: BlackRock's Bitcoin ETF alone drove the rally. Data shows that its net inflow is US$89.83 million, and its current total assets under management reach US$60.42 million. This figure far exceeds the positive net balance of the entire ETF market. In other words, without BlackRock's IBIT, the Bitcoin ETF would have been in negative territory. In fact, the numbers confirm this: Fidelity's Wise Origin Bitcoin Fund (FBTC) recorded a $43.1 million divestment, and the ARK21 Shares Bitcoin ETF (ARKB) lost $14.6 million.
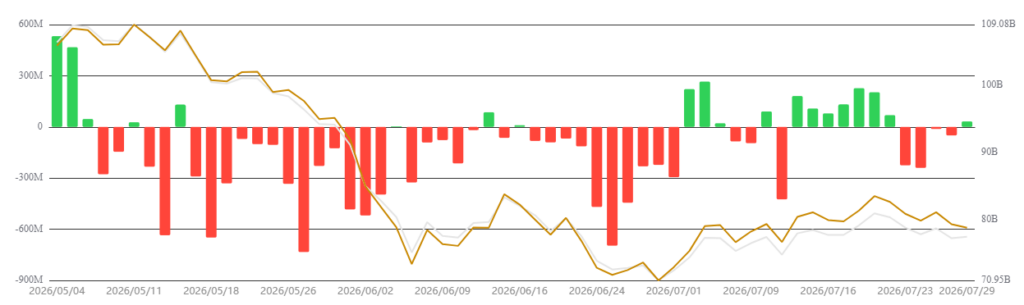 Chart showing the flow of funds in Bitcoin ETF (Source: SoSoValue)
For cryptocurrency analysts, the interpretation is clear: this is by no means a general return to Bitcoin ETFs. In fact, current developments mainly reveal the unique behavior of IBIT investors. In addition, the trend of Bitcoin's price proves this: it briefly fell below $63,300, and then rebounded slightly. As of writing, the trading price of this flagship cryptocurrency was approximately US$64,500.
Ethereum still maintains an edge in the wave of divestments
The situation for Ethereum, the world's second-largest cryptocurrency, looks less optimistic. According to data from Farside Investors, the U.S. spot Ethereum ETF recorded a net outflow of US$32.9 million on July 29, 2026. BlackRock's iShares Ethereum Trust (ETHA) attracted $5.2 million, while Fidelity's FETH fund lost $16.1 million. Similarly, a number of products from 21Shares and Grayscale have also been divested.
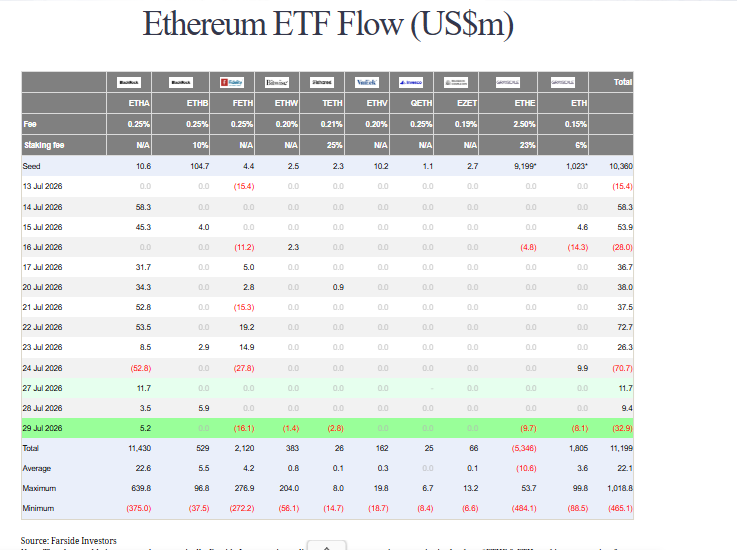 Ethereum Fund Flow Distribution (Source: Farside)
In this context, cryptocurrency analysts highlighted an important detail: Since early July, the Ethereum ETF has attracted a cumulative net inflow of US$342.9 million. This figure is significantly higher than the US$204.7 million in the Bitcoin ETF during the same period! This just means that even if it "lost the battle" on the last trading day, Ethereum will still maintain its advantage throughout the month.
Three current emerging scenarios of crypto ETFs
To answer this question, experts turned their attention to the Fear and Greed Index. The index measures investor sentiment through multiple signals: volatility, trading volume, social media, Bitcoin dominance. On July 30, the indicator was reported at 28 (out of 100), a slight decrease of 1 point from the previous day. In other words, it is currently in a fear zone. This is a significant improvement from the extreme fear of a month ago. This reading is also consistent with current price behavior for Bitcoin and Ethereum.
Scenario 1: The net inflow of Bitcoin ETFs maintains a daily pace of US$30 million to US$50 million, while the outflow of Ethereum slows down but has not reversed. In this case, Bitcoin will consolidate its position as a reference asset for institutional allocation.
Scenario 2: Outflows from ETHE dry up, thereby eliminating a structural burden on the Ethereum ETF category. Capital inflows to the Ethereum Fund resumed and were supported by technical news such as network upgrades and tokenization adoption. This scenario means that Ethereum's current poor performance is temporary.
Scenario 3: geopolitical escalation or restrictive decisions made by the Federal Reserve. This will trigger a full-scale escape of crypto ETFs and test the resilience of the entire spot ETF category.
One thing is certain: Bitcoin and Ethereum ETFs are now evolving along two different trajectories. The following trading day will determine whether investors are actually starting to accumulate or are just adjusting positions. This is a story worthy of close attention...






















