
 Exchange Ranking
 Top Exchanges
 24h Volume Ranking
 Popularity Ranking
 Exchange BTC Balance
 Proof of Reserves
 Decentralized Exchanges
 Funding Rate
 Funding Heatmap
 Liquidation Data
 Max Pain
 Long/Short Ratio
 Whale L/S Ratio
 Binance/Okex/Huobi L/S
 Bitfinex Margin L/S
 ETF Tracker
 Solana ETF
 XRP ETF
 Hong Kong ETF
 Bitcoin Treasuries
 Crypto Reversal
 Ethereum Reserves
 HyperLiquid Wallet Analysis
 Hyperliquid Whale Watch
 Large Transactions
 On-chain Movement
 Bitcoin ROI
 Stablecoin Market Cap
 Options Analysis
 News
News Articles
 Economic Calendar
 Features
 Wallet
 Contract Calculator


 Security
 Collections
 Watchlist
 Following
 ETH
ETH The net flow of Binance stablecoin fell 518% month-on-month, 347% month-on-month, and 728% month-on-month. The ETH pledge rate steadily increased from 33.44% to 33.90%, indicating that assets are gradually locked in. Weekly network cost destruction increased by 48%, but still 54% below the 90-day average. ETH needs the daily closing price to be above $2150 to confirm a bullish structural reversal.
Contents
TLDR
Binance stablecoin net flow reversed significantly
Exchange traffic and Coinbase premium send warning signals
Technical structure points to key resistance
TLDR
Binance stable currency net flow fell 518% month-on-month, 347% month-on-month, and 728% month-on-month. The ETH pledge rate steadily increased from 33.44% to 33.90%, indicating that assets are gradually locked in. Weekly network cost destruction increased by 48%, but still 54% below the 90-day average. ETH needs the daily closing price to be above $2150 to confirm a bullish structural reversal.
In the past two weeks, Ethereum has traded between $1840 and $1953, and is currently close to $1908. The online pledge rate steadily climbed from 33.44% to 33.90%, indicating that assets are gradually locked in. Among the 148 tracked indicators, one of the largest structural changes in the liquidity of stablecoins in Binhang has occurred. The indicator dropped significantly on weekly, monthly and quarterly baselines. This reversal, coupled with a weakening Coinbase premium, suggests that the Ethereum market structure is in a transition stage.
Binance stablecoin net flow reversed significantly
Ethereum's net stablecoin traffic in Binhang fell 518% month-on-month, a significant reversal. Compared with the monthly baseline, the indicator dropped 347% and 728% compared with the quarterly baseline, which is one of the largest structural changes among the indicators tracked. 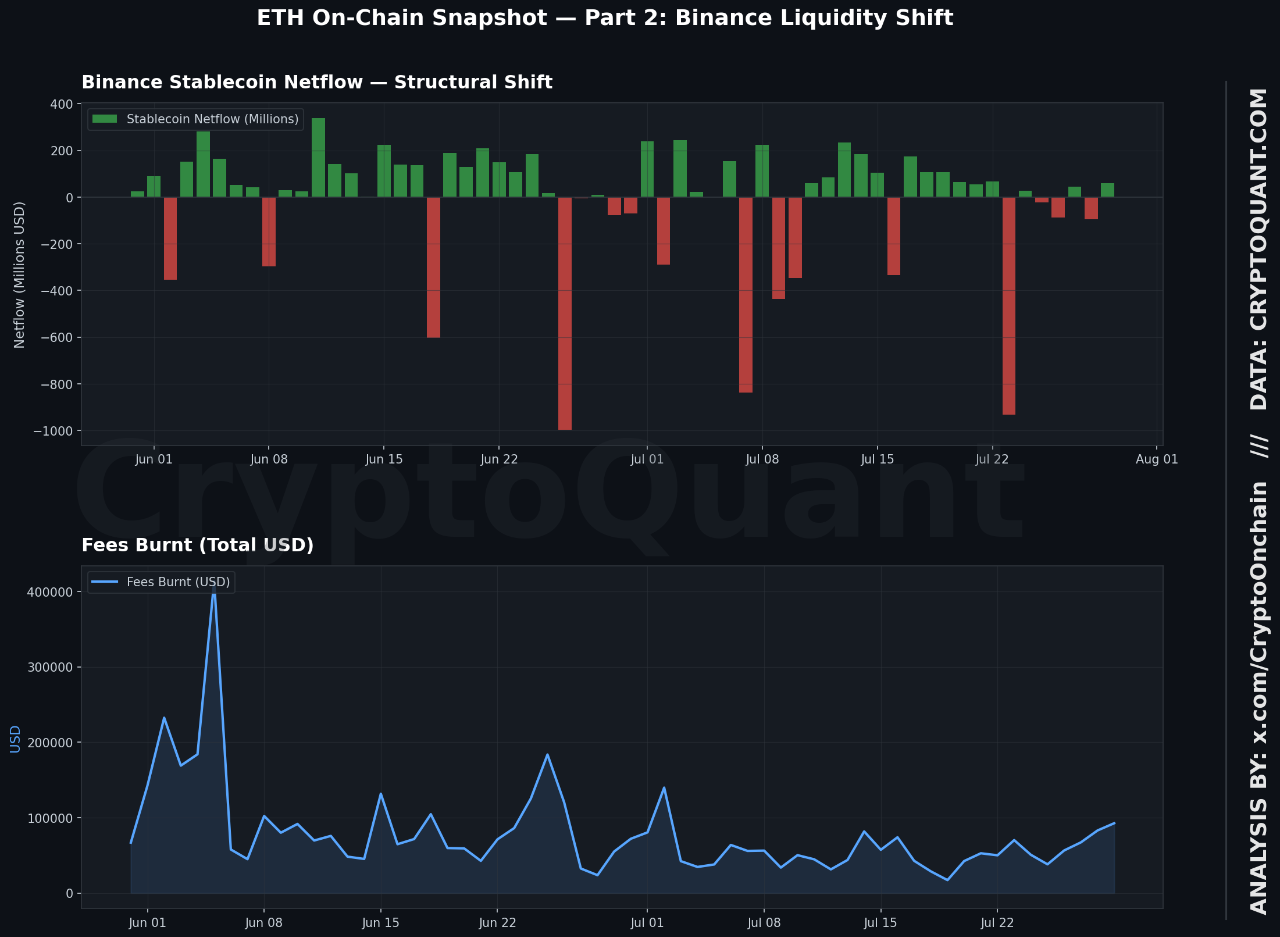
Binance is still the most liquid place for Ethereum stablecoin settlement, so its order book has attracted much attention. Since large-scale traffic changes often occur here first, this reversal provides an early signal. Analysts monitoring liquidity often view Binance data as a leading indicator of broader market relocations. The scale of this change is particularly prominent among the 148 indicators tracked in the market. Such structural changes rarely occur in isolation and tend to synchronize with trends on other exchanges. Traders concerned about the flow of Ethereum stablecoin may see this as an early warning sign.
Exchange traffic and Coinbase premium send warning signals
For most recent days, total net exchange traffic for Ethereum has remained negative. The Coinbase Premium Index also fell further, reaching-0.12. This combination may indicate weakness in U.S. spot demand relative to the overall market. This pattern usually indicates that short-term prices of mainstream assets will enter a consolidation stage. The destruction of weekly transaction fees on the Ethereum network increased by approximately 48%. Despite this, the cost is still about 54% lower than the 90-day average. This gap suggests that online activity has not yet fully recovered to previous levels. Large-scale exchange activity, tracked through top ten inbound and outbound data, is declining, and this decline is reflected in weekly, monthly and quarterly time windows. Lower participation by large players on exchanges often reflects weaker interest in short-term trading, which may indicate a decline in whale interest in recent relocations.
Technical structure points to key resistance
According to Crypto Patel's analysis, Ethereum has recently filled the fair value gap between US$1954 and US$1892. Prices continue to rebound from June lows, but the structure of the higher time frame remains short. The current rally is testing a previously respected block of bearish orders. Analysis shared by Crypto Patel on social media platform X characterizes the current rebound as a corrective rebound. Ethereum has just filled a key FVG: Mass rejection is coming? ETH continues to rebound from June lows, but the HTF structure remains short until key resistance levels are recovered.④ˇ Prices have completely covered the nearby FVG area of US$1954-US$1892 丨ˇ Current rebound is testing a... --Crypto Patel (@CryptoPatel) July 28, 2026
Daily closing prices need to be above $2150 to confirm a bullish structural shift. Failure to recover this level may cause Ethereum to fall back to around $1700. If selling resumes,$1500 remains the main downward liquidity target. The $2046 to $1975 range is the main bearish order block on the daily chart. As long as Ethereum trading is below $2150, this rally looks like a corrective rather than a confirmed reversal. Traders are watching the area closely to find the next step. A break below current support may reopen the downward previous liquidity area.






















