
 Exchange Ranking
 Top Exchanges
 24h Volume Ranking
 Popularity Ranking
 Exchange BTC Balance
 Proof of Reserves
 Decentralized Exchanges
 Funding Rate
 Funding Heatmap
 Liquidation Data
 Max Pain
 Long/Short Ratio
 Whale L/S Ratio
 Binance/Okex/Huobi L/S
 Bitfinex Margin L/S
 ETF Tracker
 Solana ETF
 XRP ETF
 Hong Kong ETF
 Bitcoin Treasuries
 Crypto Reversal
 Ethereum Reserves
 HyperLiquid Wallet Analysis
 Hyperliquid Whale Watch
 Large Transactions
 On-chain Movement
 Bitcoin ROI
 Stablecoin Market Cap
 Options Analysis
 News
News Articles
 Economic Calendar
 Features
 Wallet
 Contract Calculator


 Security
 Collections
 Watchlist
 Following
 BTC
BTC  ETH
ETH Cryptocurrency analyst Cryptollica just released a blockbuster Ethereum price forecast, which caught my attention because I haven't seen such a bullish Ethereum forecast in a long time.
In a blunt post on social media, Cryptollica fractionally compared Ethereum's current market structure to the 2018-2020 cycle, which triggered historic gains. The message from analysts is that history is repeating itself, and the next trend may far exceed most expectations.
"Ethereum reaching $20,000 will be easier than most people think  ," Cryptollica wrote. He analyzed it in four short lines: "The bottom region from 2018 to 2020 ultimately ended with a final test of upward support below the old cycle range. The structure from 2022 to 2026 is now at a similar point. Similar compression. Equally disgusted retest. The same suspicion."
Interpreting Ethereum Chart
Ethereum's weekly chart shows the fractal comparison between two different market cycles. The first period (2018 - 2020) shows that Ethereum went through a long process of bottom-building after its peak in 2018. Price action eventually compresses into an upward wedge, forming higher lows below the horizontal resistance zone in the cycle range.
The structure ended in a breakthrough, pushing Ethereum from about $130 all the way to nearly $4,800 at the top of the 2021-2022 cycle-an increase of more than 30 times from the final test point.
The second structure (2022 - 2026) reproduces this model almost perfectly. After peaking in the $4,800 region at the end of 2021 and early 2022, Ethereum spent nearly four years moving sideways within a wide range, repeatedly testing and holding on to the uptrend line formed by higher lows.
On the chart as of July 31, 2026, Ethereum prices are right at this rising support line and are currently trading around $1,780-the same "final test" position that the 2018-2020 structure presented before the breakthrough.
The core argument here is based on structural symmetry rather than price levels. Both cycles show a multi-year bottom-building period, a clear area of horizontal resistance from the previous cycle range, and an uptrend line that is repeatedly tested before a final breakthrough. The arrow on the chart pointing above $20,000 means that the same percentage range (i.e., the increase generated at the bottom of 2018-2020) will continue to the current structure. 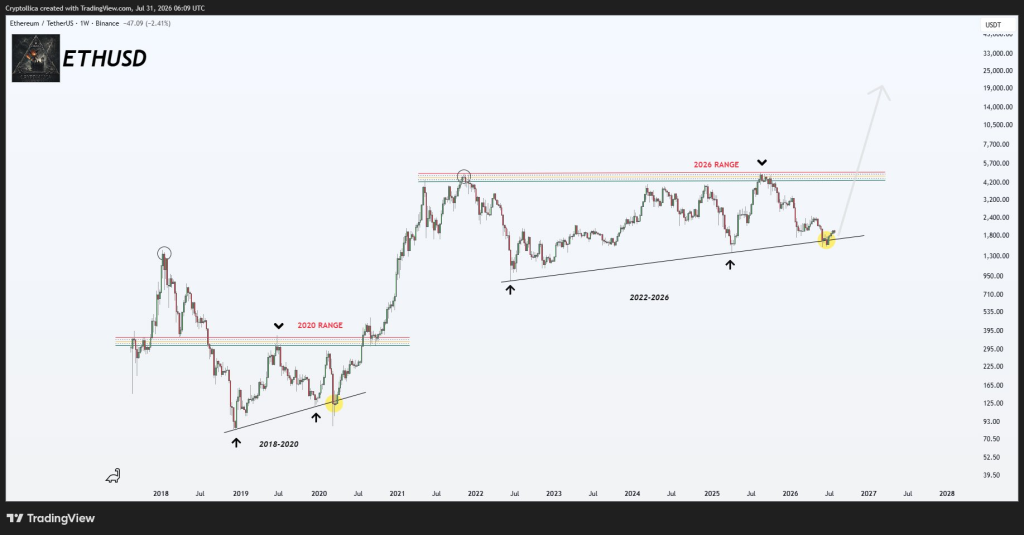
Several considerations
This type of fractal analysis has some limitations. Pattern similarities between the two cycles do not guarantee exactly the same results, and there are also significant differences between the macro environment in 2020 (low interest rates, pre-halving liquidity environment) and 2026 (markets shaped by ETF flows, the new Federal Reserve system, and the dynamics of different institutions).
Still, the compressed model itself (long-term sideways ranges, repeated testing of rising support, narrowing of volatility) is a reasonable and recognizable technical form. The current position on the chart-right on the trend line and at the multi-year low of the range-is where major directional movements, whether up or down, are likely to start.
If support fails to hold, then the bearish counterpart of this view will point to a deeper re-test of the lows of the 2022-2026 range or even the top of the old 2020 range. This makes the chart a true "watershed" scenario, where holding or breaking the trend line is more important than the specific $20,000 target.
Ethereum prices today
Ethereum fell about 1.5% today and has now fallen below US$1,900. As of Friday morning, the cryptocurrency was trading around $1,886, down from the previous trading day's close of approximately $1,918. Earlier in the session, Ethereum hovered between $1,907 and $1,918 before selling pressure pushed it lower.
On July 31, a batch of 435,000 monthly Ethereum option contracts with a nominal value of US$830 million expired and settled. A put/call ratio of 0.63 means that traders buy more downside protection than upside call options. Ethereum was trading at around $1,891 at settlement, above the "maximum pain point" level of $1,850-the Ethereum price at which the largest number of option contracts will expire. The expiration did not trigger a breakthrough in Ethereum's recent trading range.
In terms of ETFs, the U.S. spot Ethereum ETF recorded a net inflow of US$13.29 million on July 30. BlackRock's iShares Ethereum Trust (ETHA) led the way with a daily net inflow of $16.24 million, partially offset by outflows from Fidelity and Gray products. On the same day, the Bitcoin Spot ETF recorded a strong inflow of US$233.1 million.
Short-term Outlook
Many analysts believe that Ethereum will move towards the US$2,000 level in the short term. A forecast suggests Ethereum could trade at around $2,000 in early August, supported by improving ETF inflows and positive market sentiment after a difficult second quarter. The forecast trading range is between US$1,950 and US$2,050, and could move upwards to US$2,200 to US$2,400 if ETF inflows and broader cryptocurrency momentum continue. On the downside, if macroeconomic conditions deteriorate or institutional demand weakens, prices may fall back to US$1,700 to US$1,850.
Weekly level technical analysis shows that Ethereum recently broke through the resistance line of US$1,842 to US$1,868, transforming the region into new support. This opens the way to the $2,000 and the 200-day exponential moving average (approximately $2,200). However, the long-term trend remains bearish until Ethereum breaks through its 200-day moving average. At present, all eyes are still focused on the upward supporting trend line-the line that Cryptollica believes may become the launching pad for Ethereum's next major trend.






















