
 Exchange Ranking
 Top Exchanges
 24h Volume Ranking
 Popularity Ranking
 Exchange BTC Balance
 Proof of Reserves
 Decentralized Exchanges
 Funding Rate
 Funding Heatmap
 Liquidation Data
 Max Pain
 Long/Short Ratio
 Whale L/S Ratio
 Binance/Okex/Huobi L/S
 Bitfinex Margin L/S
 ETF Tracker
 Solana ETF
 XRP ETF
 Hong Kong ETF
 Bitcoin Treasuries
 Crypto Reversal
 Ethereum Reserves
 HyperLiquid Wallet Analysis
 Hyperliquid Whale Watch
 Large Transactions
 On-chain Movement
 Bitcoin ROI
 Stablecoin Market Cap
 Options Analysis
 News
News Articles
 Economic Calendar
 Features
 Wallet
 Contract Calculator


 Security
 Collections
 Watchlist
 Following
 ADA
ADA  BNB
BNB  BTC
BTC  DOGE
DOGE  ETH
ETH  HYPE
HYPE  LINK
LINK  SOL
SOL  TRX
TRX  XMR
XMR  XRP
XRP  ZEC
ZEC  LEO
LEO The cryptocurrency market is performing abnormally today: there is almost no volatility. The hourly price increases and decreases of the top 15 assets are all in the range of a few tenths of a hundred percent, while the 24-hour price increases and decreases are concentrated between a decline of 2% and a rise of 3%. This is a market waiting with breath, not looking for direction.
However, over time, the year-to-date decline is even more severe. Bitcoin fell 28%. Since January, most large-cap assets have lost one-third to half of their value. Among the top 15 assets, only three will continue to rise in 2026.
The following are the specific situations of major tokens at present.
How is the cryptocurrency market performing now?
Bitcoin traded at US$63,018, with an hourly increase of 0.06%, a daily decline of 1.23%, and a weekly decline of 1.55%. The market value is US$1.26 trillion, and the 24-hour trading volume is US$22.73 billion. 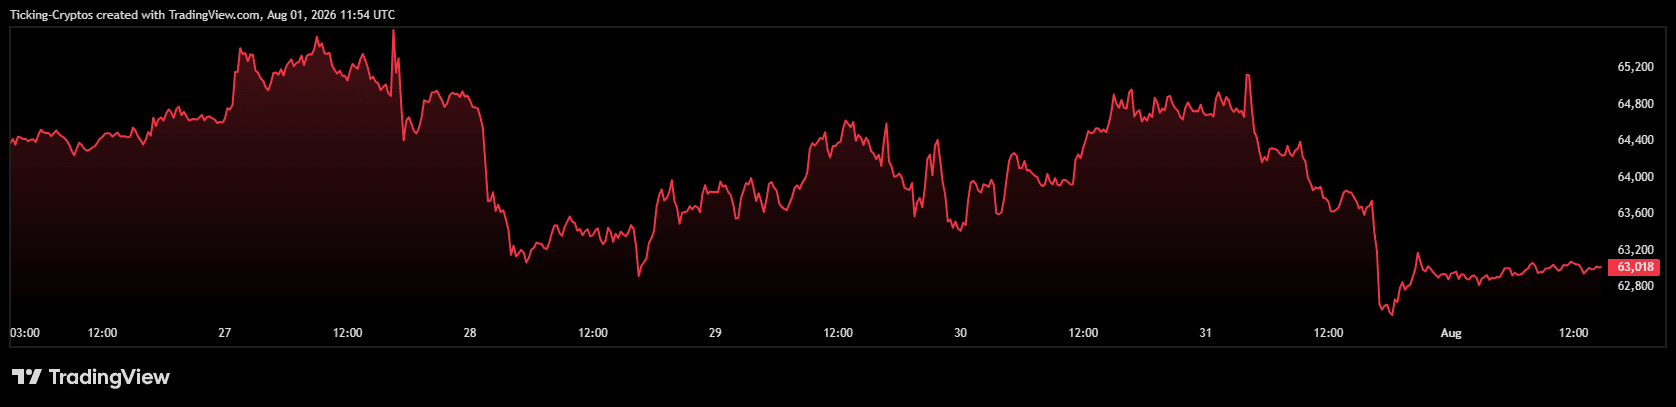 BTC/USD Chart
This trading volume data is worthy of attention. The daily trading volume is only equivalent to about 1.8% of the market value, which is low for Bitcoin. In a downtrend, low volumes usually mean sellers no longer panic selling, rather than buyers entering. This compresses the range of price fluctuations, which is exactly what today's price trend shows.
Ethereum's price was US$1,865, with an hourly increase of 0.10% and a daily decline of 0.90%, but a positive weekly increase of 0.48%. Its market value is US$225.07 billion, currently less than one-fifth of Bitcoin's market value. The year-to-date decline shows tragic results: a decline of 37.14%, which is significantly more serious than Bitcoin's decline of 27.99%. 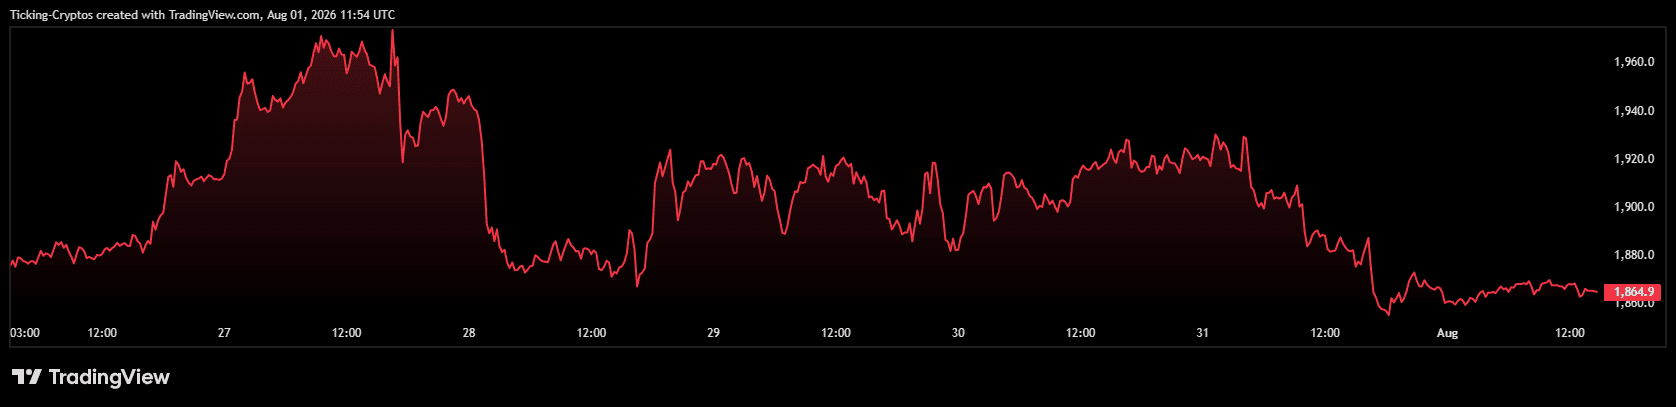 ETH/USD Chart
This gap is a decisive structural fact of this market. Ethereum outperformed Bitcoin by nine percentage points in seven months, while other smart contract sectors performed even worse.
Which assets will actually rise in 2026?
Of the top 15 assets, only three have maintained gains year-to-date, and they have nothing in common.
Hyperliquid ($HYPE), priced at US$52.03, is the absolute winner, rising 104.60% this year and having a market value of US$13.13 billion. But it was also the asset with the biggest decline today, with a daily decline of 4.89% and a weekly decline of 9.45%. A perpetual contract DEX token doubling in a market where Bitcoin fell 28%, is indeed a real anomaly, but the current weekly decline suggests that some of the excess gains are being given back.
TRON ($TRX) is priced at US$0.3274, up 15.20% year-to-date. It is the only large-cap asset other than HYPE that has seen a significant increase. It was flat today, with an hourly decline of 0.09%, and a daily increase of 0.36%. TRON's stablecoin settlement volume provides it with an income base that is largely unaffected by speculative sentiment, which is why it remains strong when speculation dries up.
The price of UNUS SED LEO was US$9.75, up 1.50% during the year and basically flat. Note its 24-hour trading volume: US$404,110, corresponding to a market value of US$8.97 billion. This is a centralized exchange token that is hardly traded, and its price stability reflects more lack of liquidity than demand.
Why do privacy coins perform better?
Zcash and Monero are noteworthy stories in this table.
Zcash ($ZEC) was trading at $463.33, a daily gain of 0.70%, and a year-to-date decline of only 9.59%. Monero ($XMR) was at $362.83, a daily increase of 3.39%, the largest increase in 24 hours among the top 15 assets, and fell 16.25% during the year.
Compare this with Cardano's 48% decline, XRP's 42% decline, and Solana's 41% decline, the divergence is extremely obvious. The loss of privacy assets is only about one-third of that of the large-cap altcoin sector.
There are two explanations for this competition. The optimistic explanation is that privacy needs do not have to do with risk appetite, so these assets have a buyer base that will not disappear if the Fed turns. A more straightforward explanation is that both have small liquidity, low trading volume, and shallow order books, so they have less fluctuations in both directions. Monero's daily trading volume of US$96.57 million is the lowest among the top 15 non-stablecoin assets (excluding LEO), which supports the second interpretation.
What is the current situation of XRP, Solana and Cardano?
This is the hardest hit area for the market in 2026.
The price of XRP was US$1.06, a daily decline of 0.85%, a weekly decline of 2.54%, and a year-to-date decline of 42.30%, with a market value of US$66.39 billion. The psychological problems are obvious: the US$1 barrier is now in the spotlight, and a break below that level will be the first time in more than a year that it has continued to fall below US$1.
Solana's price was US$72.79, a daily decline of 0.91%, and a decline of 41.52% during the year. The market value was US$42.29 billion, and the daily trading volume was US$1.22 billion. Relative to market capitalisation, its trading volume is still healthier than most assets on the list, which means Solana is still being actively traded, not abandoned.
Cardano's price was $0.1723, the worst performer among the top 15 assets in 2026, down 48.23%. But oddly enough, it was also the best-performing asset on the seventh day, rising 6.38%, and up 1.44% on the day. This combination is typical: assets have fallen enough to attract mean-returning buyers, but the fundamentals have not changed.
Chainlink's price was US$8.08, down 33.66% year-to-date and 2.01% on the day.
BNB's price was US$579.68, down 32.85% during the year, but its weekly increase was 2.56%. It is one of the few large-cap assets with a positive weekly line.
The price of dogcoin was US$0.06975, down 40.53% year-to-date, and was basically flat today.
What should traders focus on next?
Three points can be seen from this snapshot.
First, fluctuation compression. The hourly rise and fall of the top 15 assets are close to zero, which rarely lasts. Such a narrow range is bound to be broken, and the direction of the breakthrough usually follows the current trend-it is currently a downward trend.
Second, the fund rotation model. Money left in the cryptocurrency market during this round of decline went to assets with income (TRON), assets with a real product cycle (Hyperliquid), or assets whose use was not related to speculation (Zcash, Monero). They are not flowing to the 2021 generation of Layer 1.
Third, assets that closed up on the weekly basis. BNB rose 2.56%, Cardano rose 6.38%, and Ethereum rose 0.48%, which are the only significant data with positive weekly lines. This is a weak basis for any rebound argument, but it is the first time in weeks that assets outside the privacy asset sector have a positive weekly profile.
Specific to Bitcoin, the key price has not changed: the range of US$60,000 to US$62,000. Today's $63,018 is just above that range, and all assets in the table above ultimately depend on whether this support level can be held.






















