Exchange Ranking
 Top Exchanges
 24h Volume Ranking
 Popularity Ranking
 Exchange BTC Balance
 Proof of Reserves
 Decentralized Exchanges
 Funding Rate
 Funding Heatmap
 Liquidation Data
 Max Pain
 Long/Short Ratio
 Whale L/S Ratio
 Binance/Okex/Huobi L/S
 Bitfinex Margin L/S
 ETF Tracker
 Solana ETF
 XRP ETF
 Hong Kong ETF
 Bitcoin Treasuries
 Crypto Reversal
 Ethereum Reserves
 HyperLiquid Wallet Analysis
 Hyperliquid Whale Watch
 Large Transactions
 On-chain Movement
 Bitcoin ROI
 Stablecoin Market Cap
 Options Analysis
 News
News Articles
 Economic Calendar
 Features
 Wallet
 Contract Calculator


 Security
 Collections
 Watchlist
 Following
 ADA
ADA Cardano Price Forecast: ADA coin holders keep a close eye on key chart lines, and the market is ready to go.
Discussions about Cardano (ADA) price forecasts are heating up again, with holders paying close attention to a specific trend line on the chart. This line has quietly played an important role for months. In the daily time frame, a certain form is quietly brewing at the bottom, and this structure often suddenly attracts attention after being ignored for a long time. The buyer appears at a critical moment, and the price's performance in recent tests suggests that the market has not yet decided the ADA's next direction.
Cardano Today's Quotes: Real-time Data and 24-Hour Rise and Fall
As of this snapshot, Cardano's trading price was US$0.2106, down 6.15% within the day. The market value of the token has shrunk by approximately US$0.0138 in the past 24 hours. Futures volume on the exchange was US$605.03 million, while spot volume was US$142.99 million, indicating that derivatives traders are now dominating ADA's short-term price movements. Open interest positions remained at US$453.58 million, and despite the price correction, leveraged positions were not cleared on a large scale. Cardano has a market value of US$7.73 billion, a circulating supply of 36.73 billion ADAs, a total supply of 44.99 billion, and a hardtop supply of 45 billion.
Cardano News: Polymarket adds ADA to its perpetual contract product line
Cardano has gained a new distribution channel in the derivatives space. 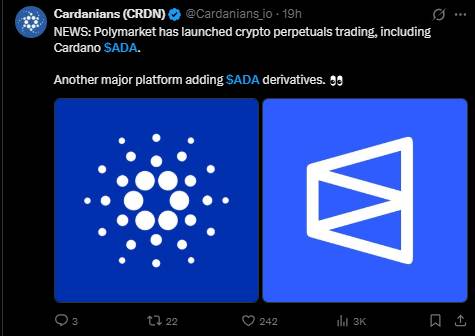 Polymarket launched perpetual contract trading in cryptocurrencies and listed Cardano's ADA as one of the available assets when it went online. This move puts ADA on par with other mainstream assets on the platform, which was previously known for its prediction market and is now gradually expanding into the perpetual futures market. For ADA, whose futures volume has far exceeded spot volume, another trading platform offering $ADA derivatives has increased the leveraged interest pool, and traders will pay close attention to this development, especially when prices are near key technical decision points.
Cardano Technical Forecast: ADA Price Forecasts and Breakthroughs
Taking an in-depth look at the daily chart,$ADA has been climbing along an uptrend line that has remained effective since mid-year. 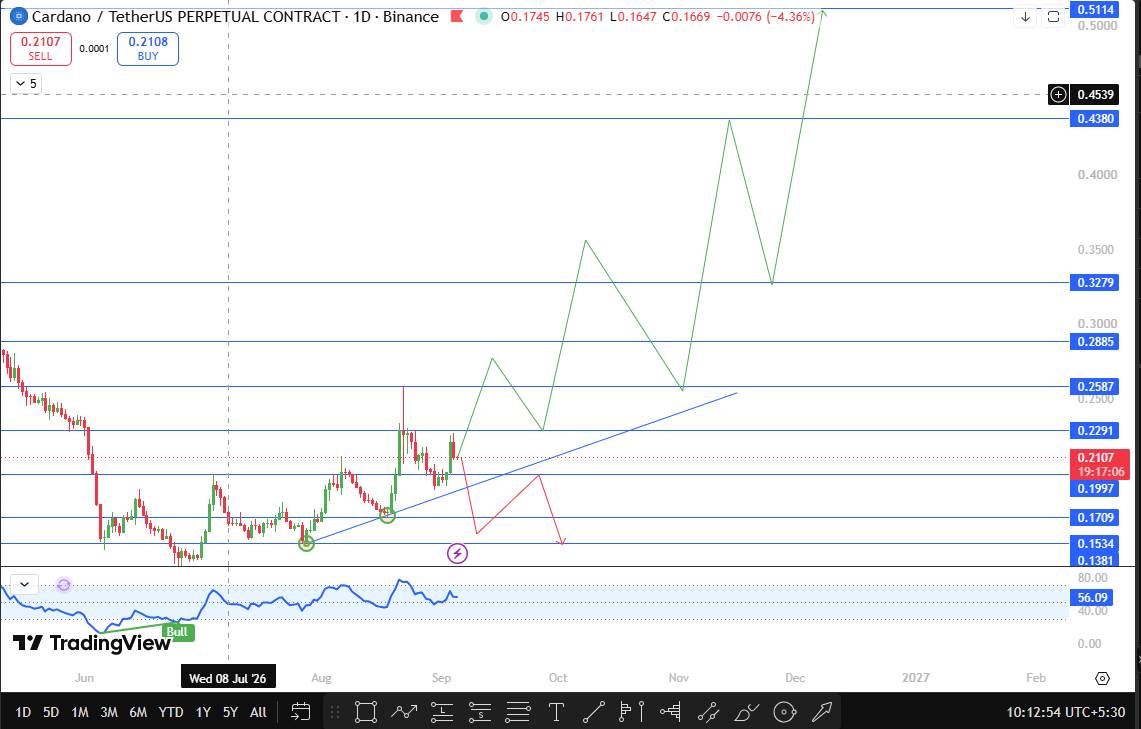 What is striking is the performance of prices in the first substantive test of the trend line: it was not a weak rebound, but the active involvement of buying, pushing prices to new highs, rather than just holding the line. This response-a strong push rather than a shallow backtest-often suggests that demand below the market is much stronger than a recent daily red column suggested.
Currently, prices are still above that trend line, but have moved back to an area where the next daily close is crucial. If the daily line closes firmly above $0.2587, it will confirm that the structure remains intact and open the door to $0.3279, which is approximately 55.6% higher than the current price. After surpassing this level,$0.4380 became the next target, nearly 107.9% higher than today's ADA trading price. The main resistance above is at US$0.5114, which if the market fully unfolded, would mark an increase of approximately 142.7% from current levels.
The other side of the structure is equally important. If the price closes below $0.1709, it confirms that the uptrend line is invalid, falling approximately 18.9% from its current position, and shifts the short-term structure from a bullish continuation to a correction stage. In this case, the next support level to focus on is at $0.1534, which is about 27.2% lower than the current price. If a position break occurs, bargain-hunting buyers may re-enter at this position.
Currently, prices are in a decision-making area. The higher highs reached in the initial backtest keep the bullish trend line scenario maintained, but the position of the daily line closing on both sides of the range will determine which ADA price target is actually tested.
Cardano Support and Resistance
Type Price Changes from Current Price Resistance 3 (Main)$0.5114+142.7% Resistance 2$0.4380+107.9% Resistance 1$0.3279+55.6% Breakout Trigger $0.2587+22.8% Current Price (CMP)$0.2107-Break Trigger $0.1709-18.9% Support 1$0.1534-27.2% Cardano Call, Benchmark and Bear Scenario Analysis
Bullish Scenario: Prices held on to the uptrend line, closing above US$0.2587 on the daily line, and exposure of additional derivatives from platforms such as Polymarket kept liquidity flowing in on the upside, targeting US$0.3279 and eventually entering the range of US$0.4380 to US$0.5114.
Benchmark scenario: Cardano fluctuated within the current range for a while, testing the trend line once or twice, but did not form a decisive daily close in any direction, essentially allowing the market to build more confidence before committing direction.
Bear scenario: If sellers force the daily to close below $0.1709, it will overturn the recent high structure and ADA may move towards the support area of $0.1534. Given the large number of open contracts currently in the market, leveraged long positions may be squeezed out.
Risks to be concerned about
Leverage is the biggest variable here. Since futures trading volume is much higher than spot trading volume, and open interest positions exceed US$450 million, the possibility of sharp fluctuations in both directions is higher than normal, and rapid changes may trigger chain liquidation before the market establishes a real trend. Broader crypto market sentiment, regulatory headlines surrounding derivatives platforms, and Cardano-specific ecosystem news are all likely to overwhelm technical analysis in the short term, so these levels should be seen as frameworks rather than guarantees.
Key Terms
Uptrend Line: A line drawn along a series of rising lows to provide dynamic support for prices as they move upwards.
Higher highs: Price peaks above the previous high are often seen as signals of continued bullish momentum.
Open interest: The total number of derivative contracts that have not yet been settled, used as a measure of active leveraged positions.
Trend line breaks: closes below the previously respected trend line, often marking the end of the trend it supports.
Disclaimer
This article is for information purposes only and does not constitute financial, investment or trading advice. The cryptocurrency market is extremely volatile, and price forecasts are based on technical analysis and may change rapidly as new market data emerge. Before making an investment decision, be sure to conduct independent research and consult a qualified financial adviser.