Exchange Ranking
 Top Exchanges
 24h Volume Ranking
 Popularity Ranking
 Exchange BTC Balance
 Proof of Reserves
 Decentralized Exchanges
 Funding Rate
 Funding Heatmap
 Liquidation Data
 Max Pain
 Long/Short Ratio
 Whale L/S Ratio
 Binance/Okex/Huobi L/S
 Bitfinex Margin L/S
 ETF Tracker
 Solana ETF
 XRP ETF
 Hong Kong ETF
 Bitcoin Treasuries
 Crypto Reversal
 Ethereum Reserves
 HyperLiquid Wallet Analysis
 Hyperliquid Whale Watch
 Large Transactions
 On-chain Movement
 Bitcoin ROI
 Stablecoin Market Cap
 Options Analysis
 News
News Articles
 Economic Calendar
 Features
 Wallet
 Contract Calculator


 Security
 Collections
 Watchlist
 Following
 LINK
LINK Chainlink price dynamics today: Real-time LINK data and 24-hour ups and downs
LINK's current trading price is approximately US$12.540, which has dropped by US$0.1575 in the past 24 hours, or a daily decline of 1.24%. In the past day, Chainlink futures volume reached US$505.16 million, and spot volume increased to US$109.23 million. This suggests that the current Chainlink price forecast discussion is supported by real trading activity rather than pure speculation. Chainlink's market value is currently close to $9.36 billion, and open interest is worth $700.25 million, meaning there is a lot of leveraged money being bet on the next market trend. The circulation supply is 748.09 million LINKS, which is close to the total supply and the maximum supply of 1 billion, which means that the vast majority of Chainlink tokens are already in the hands of holders and traders.
Source: CoinGlass, Chainlink data, September 8, 2026
Chainlink News: Space and Time adopts Chainlink privacy standards
The highlight of Chainlink's latest news comes from a post posted by BSCN on the X (formerly Twitter) platform, which will be released at 11:32 pm on September 8, 2026. The post reported that Space and Time has adopted Chainlink's privacy standards for its Virtual Vaults. 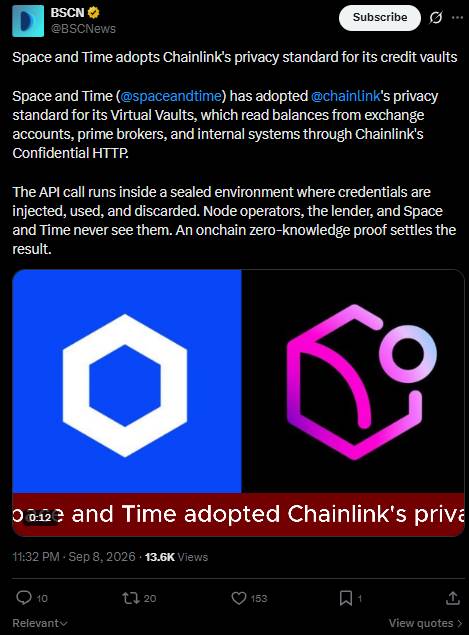 According to the post, the vaults read balances from exchange accounts, major brokers and internal systems via Chainlink's Confidential HTTP. API calls run in a sealed environment where credentials are injected, used and then discarded, so node operators, lenders, and Space and Time itself cannot see these credentials, and the end result is settled through zero-knowledge certificates on the chain. This kind of Chainlink news points directly to the Oracle Network's growing role in institutional financial infrastructure, adding substance to current Chainlink trend analysis, rather than just hype. The post has received more than 13,600 views in just a few hours, demonstrating the strong interest of the cryptocurrency community.
Source: BSCN (@BSCNews) Published on X, September 8, 2026, 11:32 pm
LINK Quick Overview: Key Triggers and Support Levels
- CMP (Current Market Price):$12.540 (4-hour chart, Binance)
- Breakthrough trigger conditions: Breakthrough required and close above $13.654 to confirm that the breakthrough is valid
- Break through trigger conditions: Break below required and close below $11.500 to open up further downside
- Data Timestamp: September 8, 2026
- Risk warning: The value of open interest of US$700.25 million means that once the direction is clear, leveraged positions may trigger a violent reaction
Chainlink Technical Analysis: LINK Price Forecast and Trend Outlook
Observing the 4-hour LINK chart on which the coin is installed, the price has steadily climbed along an upward trend line. The candle chart closely respects the trend line and shows a controlled and orderly upward trend. This structure usually reflects continued buying interest rather than a brief speculative surge, which is typical of the pattern anyone doing serious Chainlink technical analysis will focus on. However, prices have recently fallen below this uptrend line, a move that is often seen as an early warning sign of more downside risks. But what is striking is that the expected situation has not happened since then. Although the trend line was broken, aggressive selling did not occur. Prices stabilized and did not accelerate their decline. When a break fails to attract real selling pressure, it often means sellers also lack confidence, which increases the probability of a sharp upward reversal rather than continuing to decline.
The key level to confirm this reversal is $13.654. If the 4-hour closing price returns above this level, the breakthrough will be confirmed. Given that the current selling is so silent, a confirmed breakthrough of that level could lead to a truly aggressive rebound rather than a slow climb. Since then, the next resistance level for this LINK price forecast is at US$15.042, approximately 20.0% higher than current prices, and the further target is US$20.011, nearly 59.6% higher than CMP. A rise of this magnitude may require strong follow-up buying, a long period of buying accumulation, rather than a single push. On the other hand, if prices fail to stabilize here and close below $11.500, the story will be very different. A close at this level marks a decline of about 8.3% from current levels and suggests that a break in the trend line is finally accompanied by real selling pressure. In this case, the next support level to focus on in this Chainlink price forecast is US$10.895, which is approximately 13.1% lower than CMP. The lack of follow-up selling after the trend line breaks down before one of the levels confirms the close remains the most important detail on the chart.
Link Support and Resistance Levels to Watch
Type Price Relative to CMP ($12.540) Change main resistance level $20.011 + 59.6% breakthrough confirmation level $15.042 + 20.0% reversal trigger level $13.654 + 8.9% Current market price $12.540 -Break trigger level $11.500 -8.3% Support level $10.895 -13.1% LINK Price Forecast Scenario: Bull Market, Benchmark and Bear Market
Bull Market Scenario: There was no selling after the trend line broke, which was just as it appeared on the surface and was an early sign that sellers were running out of strength. The price reversed and closed above US$13.654, confirming that the breakthrough was effective, opening the path to US$15.042, and looking further towards US$20.011 if momentum is strong. The growing institutional adoption news surrounding Chainlink's privacy infrastructure may boost the confidence of buyers re-entering here.
Benchmark scenario: Prices have stagnated between US$11,500 and US$13,654 for some time, and a reversal or break point cannot be clearly confirmed. Given that prices have been hesitant since the trend line broke, this kind of lateral volatility is not surprising, and this is usually the healthiest state before truly directional markets take shape.
Bear market scenario: If the current calm is only temporary and sellers eventually intervene forcefully to push the price below $11,500, a bear market scenario will occur. This will confirm that a break in the trend line is the beginning of a real downtrend rather than a pause, and the focus will move down to $10.895 as the next support level. Closing at this level will represent a real shift in structure, and this level will be critical if downward pressure starts to build.
Risks of this Chainlink price outlook
The lack of aggressive selling after the trend line broke is a constructive signal, but it is not a confirmed reversal until the price actually closed again above $13.654. The broader cryptocurrency market trends, Bitcoin's own price movements, and overall shifts in risk sentiment may all override such coin-specific settings. With the value of open interest close to US$700.25 million, any confirmed movement could be amplified in either direction through liquidation. This article is for reference only and should not be regarded as financial advice.
Chainlink price forecast key terms
Ascending Trendline: connects a series of rising lines of higher lows, marking where buyers have repeatedly intervened in the uptrend.
Trendline Break: Prices close above previously respected trend lines and are often used as an early signal of a potential trend shift.
Breakout Confirmation: A decisive close beyond key resistance levels verifies a real change in trend direction rather than a temporary move.
Open Interest: The total value of asset open derivative contracts, used to measure the size of active leveraged positions in the market.
Support and Resistance: Price ranges where historical buying or selling pressures are strong enough to suspend or reverse price movements.