Exchange Ranking
 Top Exchanges
 24h Volume Ranking
 Popularity Ranking
 Exchange BTC Balance
 Proof of Reserves
 Decentralized Exchanges
 Funding Rate
 Funding Heatmap
 Liquidation Data
 Max Pain
 Long/Short Ratio
 Whale L/S Ratio
 Binance/Okex/Huobi L/S
 Bitfinex Margin L/S
 ETF Tracker
 Solana ETF
 XRP ETF
 Hong Kong ETF
 Bitcoin Treasuries
 Crypto Reversal
 Ethereum Reserves
 HyperLiquid Wallet Analysis
 Hyperliquid Whale Watch
 Large Transactions
 On-chain Movement
 Bitcoin ROI
 Stablecoin Market Cap
 Options Analysis
 News
 Articles
 Economic Calendar
 Features
 Wallet
 Contract Calculator


 Security
 Collections
 Watchlist
 Following
 ETH
Core Insights
Ethereum prices remain near $2700 as traders weigh conflicting signals. Open interest positions in futures remained at around US$33.69 billion, and leverage remained at a high level. Before the activation of the Glamsterdam-Sepolia test network on October 6, the exchange's capital flows were mixed.
On October 4, Ethereum prices were trading around $2700, and traders were evaluating conflicting signals in terms of technical, derivatives and exchange capital flows. Although Ethereum's price structure is still higher than it was at the end of September, analysts have mixed views on the next direction. CoinMarketCap data shows that ETH prices are about $2702, up less than 1% in 24 hours.
This situation is important because leveraged positions remain high and spot funds flow is uneven. CoinGlass data shows that open interest positions in Ethereum futures are close to US$33.69 billion. If prices fall below key levels, high leverage may increase liquidation risks.
Ethereum prices remain around US$2700
CoinMarketCap data shows that the Ethereum trading price on October 4 was approximately US$2702. The asset closed at approximately $2687 on October 3 and $2668 on October 2. This puts ETH prices above its late-September trading range, but still below some of the stronger breakthrough targets shared by technical analysis traders. CoinMarketCap's historical ETH/USD data shows that Ethereum prices have increased by approximately 7.1% in the past 30 days. This provides buyers with a moderate basis for rebound after September's volatility.
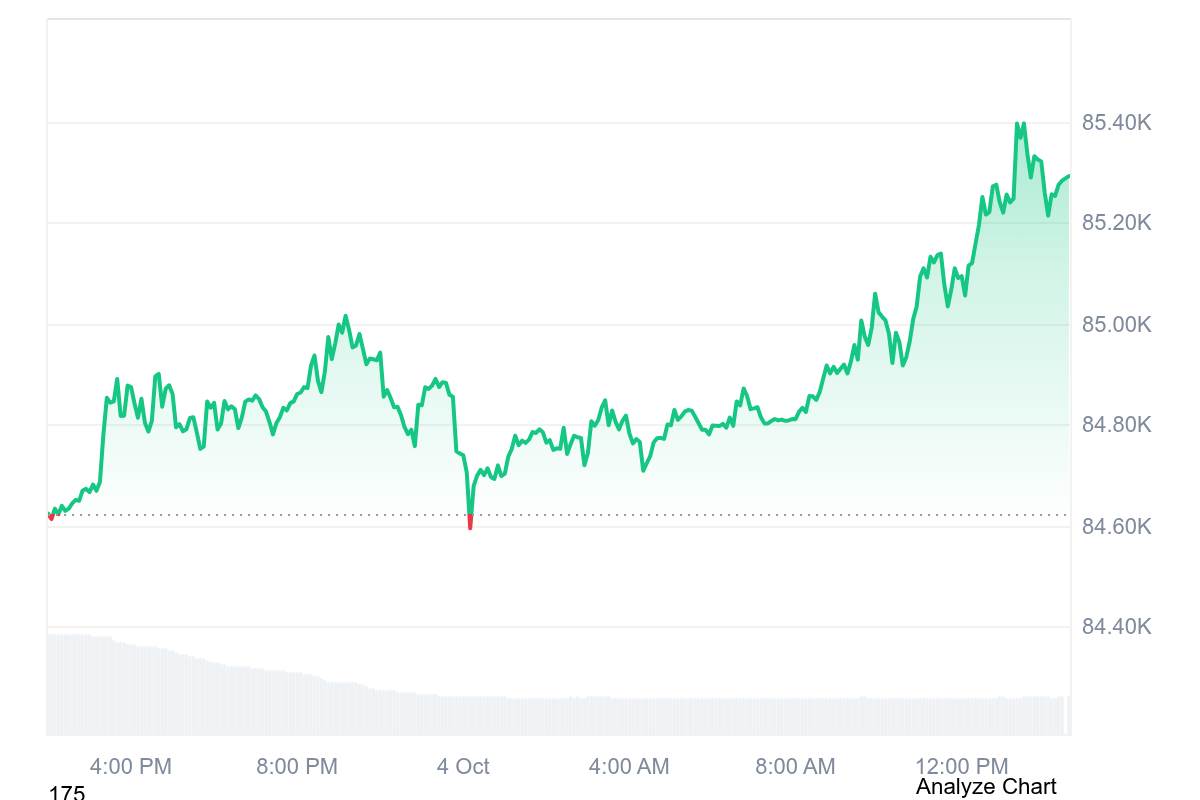 Ethereum price trend chart. Source: CoinMarketCap
As a result, Ethereum's price structure remains constructive, but new trends have not yet been confirmed. Analyst Elja pointed out that the ETH/BTC trading pair has reached a trend-line area, similar to the structure in which Ethereum outperformed the market in the early days. The analyst compared the current structure with breakthroughs observed in 2017 and 2020.
This comparison is only a technical analogy, not a prediction. Similarities in historical charts do not guarantee that the same price response will occur.
Ethereum prices face conflicting technical signals
Other analysts take a more cautious view. K A Y said that Ethereum has formed a rising wedge shape. Traders typically view this pattern as a bearish signal after downside support fails. Analysts determined that if Ethereum loses its lower boundary, the next potential decline area is $2400.
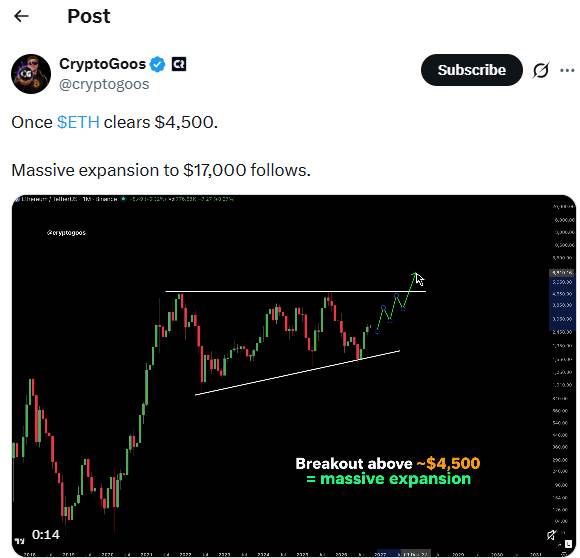 Ethereum aims for a $4500 breakthrough, targeting $17000. Source: X CryptoGoos
CryptoGoos holds the opposite view, believing that a breakthrough of US$4500 may open up more upside. This target is much higher than the current price of Ethereum and needs to break through several resistance levels first.
Tracer separately compared Ethereum's chart structure to historical Apple settings. This comparison is also observational and does not provide independent evidence of repeating similar trends.
As a result, Ethereum's price outlook depends more on confirmatory breakthroughs than on chart similarities. Breaking through recent resistance will strengthen the bullish argument. If a break occurs, attention will shift to lower support levels.
Derivatives and exchange fund flows remain mixed
CoinGlass data showed that open contract positions in Ethereum futures on October 4 were approximately US$33.69 billion. Futures trading volume over a 24-hour period was approximately US$25.04 billion, indicating active leveraged participation around current ETH prices.
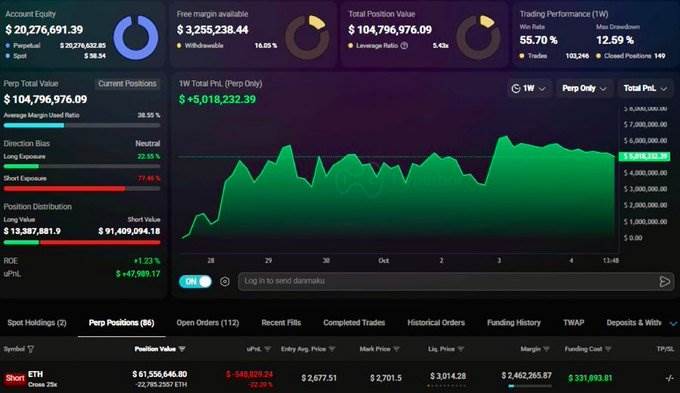 Whales opened a US$61 million short order for Ethereum near US$3014. Source: X That Martini Guy
The Martini Guy posted that a trader opened a short position in ETH worth approximately US$61 million. Posts showed the position's strong parity level close to $3010. This position alone cannot independently judge the direction of the market, but it suggests that some large traders are still betting that further gains will be blocked.
CryptoQuant data also shows mixed exchange behavior. Recent records on its exchange funds flow dashboard showed that net inflows to the Ethereum exchange were approximately 17,492 ETH. CryptoQuant defines a positive net inflow as more coins entering the exchange than coins leaving. This could increase the supply available for sale.
Data from early September showed the same inconsistency. CryptoQuant analyst theophilus pepre reported that Binance received approximately 709,400 ETH during a daily peak on September 17. The analyst also tracked whale activity that individually extracted more than 5,000 ETH from major exchanges.
This combination suggests a reallocation of positions rather than a unilateral accumulation. CryptoQuant's exchange funds flow dashboard also shows that approximately 14.66 million ETH are held in the exchange wallets tracked. Its methodology warns that recent data may change as wallet clusters are updated. Therefore, exchange capital flows alone are not enough to clearly support Ethereum's price structure.
Ethereum Price Focus on Internet Catalyst on October 6
The catalyst for the next plan comes from Ethereum's agreement roadmap, not market positioning. The Ethereum Foundation announced that Glamstam will be activated on the Sepolia Test Network at 13:53:36 UTC on October 6.
This upgrade introduces an embedded proposer-builder separation (PBS), block-level access lists, and a revised Gas accounting mechanism. The activation time of the main network has not yet been announced. This makes the October 6 activation of the Sepolia testnet the most recent confirmed protocol event. This time point provides traders with a clear picture of recent monitoring events.
For traders, immediate technical points are more important than long-term agreement development. Ethereum prices must hold on to recent rebound areas while challenging resistance above current levels. If the breakthrough fails, the focus will return to $2400. If the momentum remains strong, attention will turn to $3000.