Exchange Ranking
 Top Exchanges
 24h Volume Ranking
 Popularity Ranking
 Exchange BTC Balance
 Proof of Reserves
 Decentralized Exchanges
 Funding Rate
 Funding Heatmap
 Liquidation Data
 Max Pain
 Long/Short Ratio
 Whale L/S Ratio
 Binance/Okex/Huobi L/S
 Bitfinex Margin L/S
 ETF Tracker
 Solana ETF
 XRP ETF
 Hong Kong ETF
 Bitcoin Treasuries
 Crypto Reversal
 Ethereum Reserves
 HyperLiquid Wallet Analysis
 Hyperliquid Whale Watch
 Large Transactions
 On-chain Movement
 Bitcoin ROI
 Stablecoin Market Cap
 Options Analysis
 News
 Articles
 Economic Calendar
 Features
 Wallet
 Contract Calculator


 Security
 Collections
 Watchlist
 Following
 XRP
XRP prices are under pressure, EGRAG Crypto: Long-term bullish structure remains intact
After the latest round of comprehensive market decline, XRP prices are still under pressure, but analyst EGRAG Crypto believes that its long-term bullish structure remains intact. His latest monthly chart focuses on one key price point: $1.20. EGRAG believes that XRP prices may pull back into the region while remaining within a macro bullish structure. However, if the monthly line continues to fall below this level, he will have to re-examine the entire bullish logic. At present, he firmly believes that the main bottom has been formed.
Why is US$1.20 the "red line" of EGRAG?
The chart places XRP within a broad macro range, with $1.20 marked near the lower boundary of the current structure. The reasons why this level is important are as follows:
First, XRP still runs above the long-term 111-cycle exponential moving average (EMA), shown in blue. In previous market stages, this moving average has been used as an important cyclical reference indicator in EGRAG's charts.
Secondly, prices are still close to the 33-cycle EMA (green display). EGRAG views this short-term long-term moving average as an important sign of resistance and support during major cycle transitions.
As a result, the current structure is compressed between long-term downward support and upward resistance. EGRAG's view is that as long as the monthly close is not established below $1.20, XRP can continue to bottom out without disrupting the larger bullish pattern. If this level falls short in terms of sustainability, the current structure will no longer manifest as a normal macro adjustment.
XRP Chart Analysis
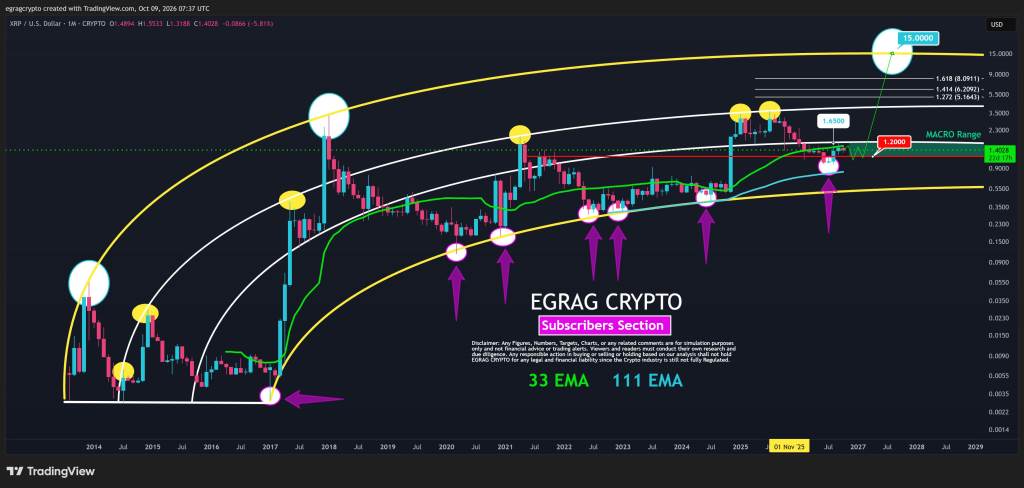
The most interesting part of the EGRAG chart is how XRP interacted with these same moving averages in previous cycles. The chart goes back more than a decade and marks several major turning points with circles.
In the early stages, a deep correction to the long-term downward moving average is often followed by strong market expansion. The 2017 cycle is the clearest example. XRP experienced a long period of compression and consolidation near long-term support levels, and then finally accelerated into the main rising market. A similar structure reappeared in later cycles, with 111 EMA serving as a broad supporting reference and 33 EMA playing an important role in the recovery process.
EGRAG believes that the market is currently building a structure around these long-term moving averages. This does not mean that history will simply repeat itself, but it explains why he views the current decline as part of structural construction rather than a complete failure of bullish logic.
US$1.65 is the first major recovery target
在交易者开始考虑4美元、8美元或15美元之前,XRP有一个更近的目标需要处理。EGRAG将1.65美元标记为第一个主要收复水平。这一水平的重要性在于,它将使XRP价格回到当前宏观区间之上,并显著改善短期结构。
随后,图表在其上方标注了几个更高的斐波那契扩展位,包括:
- 1.20美元:主要宏观支撑及失效区域
- 1.65美元:首个主要收复位
- 5.16美元:1.272倍斐波那契扩展位
- 6.21美元:1.414倍斐波那契扩展位
- 8.09美元:1.618倍斐波那契扩展位
- 15美元以上:长期“瓦尔哈拉”情景
因此,5.16美元至8.09美元的区间并非单一目标,而是一个更广泛的斐波那契扩张区域。只有当XRP首先从当前区间恢复,并果断突破1.65美元时,该区域才具有实际意义。
为何15美元目标更具投机性?
EGRAG图表中最激进的部分是对15美元的预测。图表上方的黄色曲线代表了一个更大的长期通道,EGRAG映射了XRP清除当前宏观区间后潜在向该区域移动的路径。
From a technical perspective, the chart provides a path. But from a fundamental perspective,$15 and $1.65 are completely different concepts. If the price of XRP reaches US$15, its market value will be close to US$1,000 based on its current supply. This requires stronger capital inflows, broader cryptocurrency participation, and continued institutional demand.
Therefore, the most practical way to view the chart is to view it in stages. The first question is whether $1.20 can be held; the second is whether XRP can recover $1.65. Only when these two conditions are met do higher Fibonacci goals become more relevant.
XRP Price Outlook
EGRAG's chart is long-term bullish, but also provides traders with a very clear failure point. As long as XRP remains above $1.20 on the monthly line, he views the current decline as part of a larger bullish structure. A rebound through $1.65 will strengthen this logic and reopen the path to the $5 to $8 Fibonacci area.
The monthly line continues to fall below US$1.20 will be a more serious development. So, despite the attention paid to the $15 target, the most important figure on this chart is not $15, but $1.20.