
 Exchange Ranking
 Top Exchanges
 24h Volume Ranking
 Popularity Ranking
 Exchange BTC Balance
 Proof of Reserves
 Decentralized Exchanges
 Funding Rate
 Funding Heatmap
 Liquidation Data
 Max Pain
 Long/Short Ratio
 Whale L/S Ratio
 Binance/Okex/Huobi L/S
 Bitfinex Margin L/S
 ETF Tracker
 Solana ETF
 XRP ETF
 Hong Kong ETF
 Bitcoin Treasuries
 Crypto Reversal
 Ethereum Reserves
 HyperLiquid Wallet Analysis
 Hyperliquid Whale Watch
 Large Transactions
 On-chain Movement
 Bitcoin ROI
 Stablecoin Market Cap
 Options Analysis
 News
News Articles
 Economic Calendar
 Features
 Wallet
 Contract Calculator


 Security
 Collections
 Watchlist
 Following
 ETH
ETH Ethereum prices need to fall one last time before ushering in the next major market-the key price is here
Ethereum is currently trading near a key price that may determine its next major price trend. After falling nearly 64% from an all-time high of about $4900 to the current level of about $1773, ETH has entered a consolidation phase, which seems to be laying the foundation for a larger market. However, the chart shows that Ethereum may still need to take one last dip before a sustained recovery begins.
Ethereum Price Today: How did ETH drop from US$4900 to US$1780?
Ethereum's decline was not a one-time continuous sell-off, but went through multiple different stages. The first major break occurred after ETH failed to hold on to $4000, ending the previous bull market structure and establishing a new downward trend. Once the $3,500 - 3,600 support fell, the bears took control and the market formed a series of lower highs and lower lows. After falling below the psychological threshold of $3000, the decline intensified. Selling pressure intensified in the range of about $2,500 - 2,600 and triggered a violent liquidation event that pushed Ethereum below $2000. The current price trend is no longer like a panic selling, but more like a long-term fundraising stage after completing the macro downward trend.
Ethereum Chart Analysis: Key Prices that Must Be Held Before Any Recovery
1700-1720 The dollar support area is currently the most important level on the chart. During the recent consolidation process, the region has repeatedly played the dual role of resistance and support. There are several technical reasons why this price is important: it is near the midpoint of the current multi-month trading range and coincides with the high-volume consolidation area where buyers entered previously. Despite repeated tests, the daily chart holds on to this area, and the recent rebound towards $1850 is a direct result of this support.
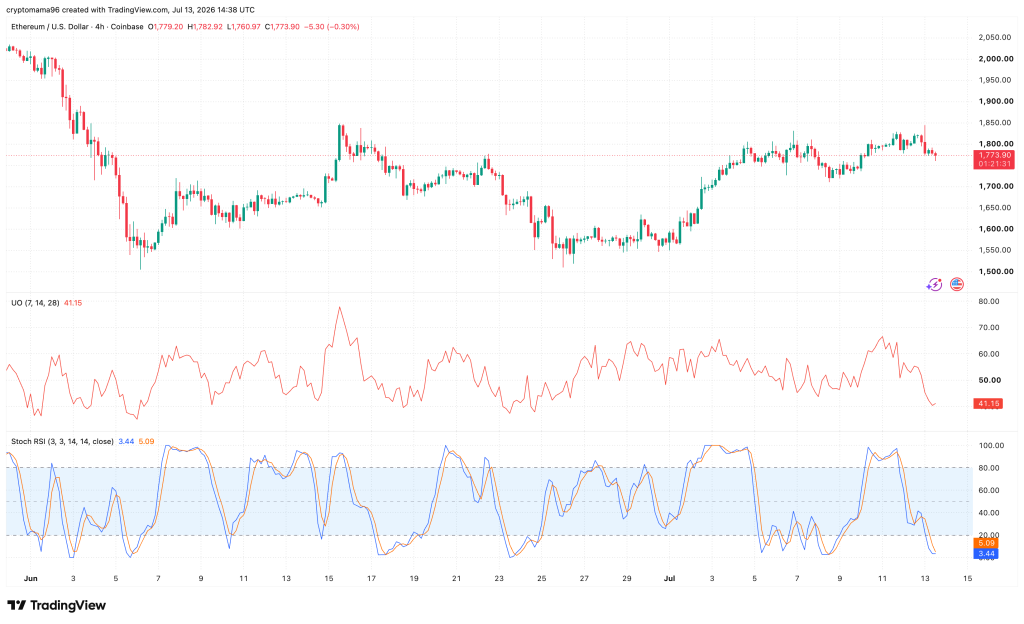
The 4-hour plot shows its importance. Ethereum recently failed to hold above US$1,820 - 1,840 and formed a lower high before falling back towards support. The momentum indicator confirmed the cooling trend, with the ultimate oscillator falling to around 41, and the 4-hour Stocking Relative Strength Indicator (Stocking RSI) re-entering the oversold area. These readings suggest that short-term selling may be close to exhaustion. If $1700 is clearly broken below under high trading volume, the technical structure will undergo major changes. The next downside target will become $1620, then $1550.
Why another decline is actually healthy
Ironically, another decline could improve Ethereum's long-term prospects rather than weaken it. Daily charts show momentum is cooling after weeks of rebound from June lows. From a technical perspective, a final wash can serve multiple purposes: it will clear weak bulls that entered the market during the recent rally, trigger remaining stop orders below recent lows, reset an already overheated momentum indicator, and if buyers quickly regain support, it will create a higher low with a higher probability. The daily ultimate oscillator has dropped from above 60 to around 45, while the 4-hour Stocking Relative Strength Indicator (Stocking RSI) has returned to oversold territory.
Ethereum Price Forecast: Where will ETH go after the last wash?
The chart currently leans towards a range-volatile market that is preparing for the next directional move. A bullish scenario requires $1700 to remain held while momentum turns higher. Initial resistance is at $1,820 - 1,850, and confirmation that a breakthrough will open the path to $1,950 - 2,000. Recovering $2000 will negate the recent series of lower highs and improve Ethereum's medium-term technical aspects. Above $2000, the next major resistance level is around $2,200 - 2,300, where there was a previous denseness of daily lines. Confirmation signals will come from higher lows on the 4-hour chart, the Stochastic Relative Strength Indicator (Stocking RSI) re-crossing up from oversold territory, the Ultimate Oscillator breaking 50, and strong volume accompanying a breakthrough of $1850. A bearish scenario occurs when ETH clearly closes below $1700. The market may stretch to $1620, then $1550, and $1500 will become the next major fundraising area. If buyers manage to hold on to $1700 and recover $1850, then the current correction may ultimately prove to be the last wash before Ethereum begins building into the $2,000 - 2,300 range.
FAQs
Will ETH fall again?
Yes, another callback is possible. Ethereum remains below the main resistance level and price fluctuations remain common. Maintaining support is crucial to any sustained recovery.
Will Ethereum fall in 2026?
If market sentiment weakens or key support levels fall, Ethereum may decline further. At the same time, ETF demand, network upgrades and pledge activity may support the recovery later this year.
Is now a good time to buy ETH?
This depends on your investment goals and risk tolerance. Long-term investors typically buy when the market is weak, while short-term traders may wait until a breakthrough is confirmed before acting.






















