
 Exchange Ranking
 Top Exchanges
 24h Volume Ranking
 Popularity Ranking
 Exchange BTC Balance
 Proof of Reserves
 Decentralized Exchanges
 Funding Rate
 Funding Heatmap
 Liquidation Data
 Max Pain
 Long/Short Ratio
 Whale L/S Ratio
 Binance/Okex/Huobi L/S
 Bitfinex Margin L/S
 ETF Tracker
 Solana ETF
 XRP ETF
 Hong Kong ETF
 Bitcoin Treasuries
 Crypto Reversal
 Ethereum Reserves
 HyperLiquid Wallet Analysis
 Hyperliquid Whale Watch
 Large Transactions
 On-chain Movement
 Bitcoin ROI
 Stablecoin Market Cap
 Options Analysis
 News
News Articles
 Economic Calendar
 Features
 Wallet
 Contract Calculator


 Security
 Collections
 Watchlist
 Following
 ETH
ETH The Ethereum price trend chart shows a bullish engulfing pattern. Historical data shows that this pattern has triggered two rounds of sharp rises.
Ethereum prices have been under pressure for several months, and each attempt to rebound has failed to accumulate enough momentum to reverse the overall trend. Because of this, a chart pattern that appeared before Ethereum's previous two major rallies has now regained attention. This latest pattern comes after another long decline and raises a key question: whether ETH is finally ready for a stronger recovery.
Cryptocurrency analyst Crypto Patel believes that the latest weekly chart has shown the third bullish engulfing pattern in this market cycle. After appearing the same pattern twice before, ETH rose by 169% and 253% respectively. Although Ethereum's current trading price is still well below cyclical highs, this pattern is still worthy of attention.
The condition for the formation of a bullish engulfing pattern is that a large weekly positive line completely covers the previous negative line. Technical analysts often view this as evidence that buyers have absorbed selling pressure and regained control after a long decline.
Crypto Patel pointed out that Ethereum has appeared in this form for the third time in this cycle. The first two appearances were followed by increases of 169% and 253% respectively, making the latest form one of the most interesting technological developments on the Ethereum price chart.
The chart also shows several encouraging technical signs:
This is the third time in the current market cycle that a bullish engulfing pattern has occurred.
After the previous two similar patterns appeared, ETH rose by 169% and 253% respectively.
Price movements in higher time frames suggest a possible bullish reversal.
Near key demand areas, selling pressure seems to be being absorbed.
After months of downward shifts in highs and downward shifts in lows, the trend structure began to improve.
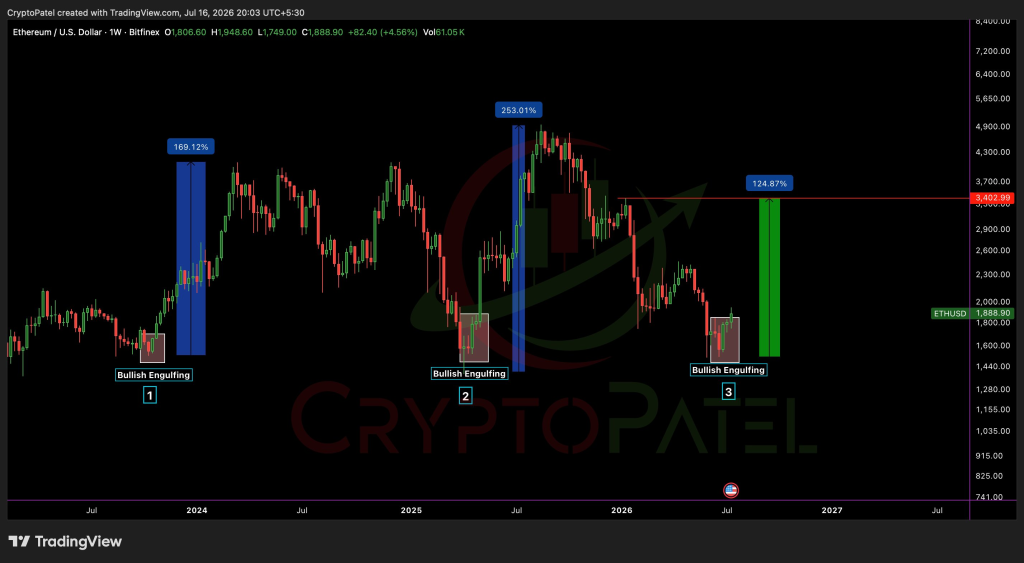
Crypto Patel believes that ETH may move towards US$3400, which has about 125% room for upside compared to the price level shown on the chart. Crypto Patel also highlighted an important condition: Weekly lows formed by bullish engulfing patterns must remain intact. A break below this level would weaken the effectiveness of the current bullish pattern and reduce the possibility of another strong rise.
Ethereum prices are still well below previous cycle highs
This technical pattern comes after a difficult period for Ethereum prices. ETH climbed to the mid-range of US$4000 at the end of 2025, and then its gains weakened. Selling pressure quickly returned, with Ethereum falling to about $3022 in November 2025 and remaining near $3000 until the end of the year.
Pressure continues throughout 2026. ETH traded at about $2144 in February, before slipping to about $2052 in March. Attempts to recover to about $2376 in April failed to form a lasting trend, and selling pressure returned again. Ethereum then traded close to $2022 in May and fell further to about $1917 in July.
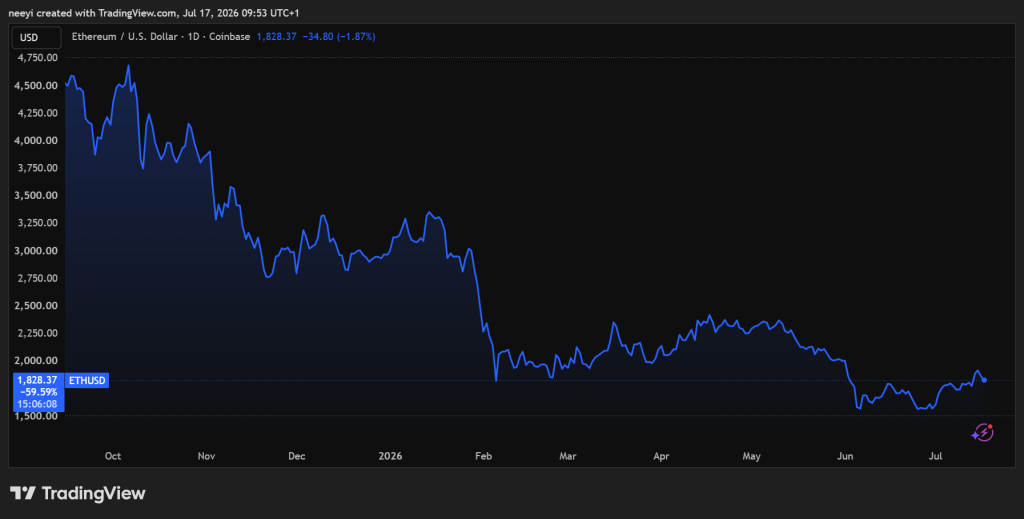
This steady decline is different from a panic plunge. Ethereum prices continue to fall through a series of moves down highs and lows. Every rebound attempt has difficulty standing above the low $2000 area, indicating that despite multiple rallies, buyers have not yet fully regained control.
Another factor deserves attention. Ethereum's current price is down by about half from its high at the end of 2025, while the overall retracement from its all-time high is even greater. That means any future rally towards the mid-$4000 region could face heavy selling pressure from investors buying near previous highs.
The price outlook for Ethereum depends on whether buyers can build an advantage based on this signal.
The recurrence of this bullish engulfing pattern does not guarantee another rally. Market conditions are very different from the early stages of the cycle, and Ethereum still faces several important resistance levels.
Several paths may emerge in the coming weeks:
Recovery scenario: Breaking through recent rebound highs, supported by strong trading volume, may open up space for the upper $2000 region. After a successful breakthrough,$3000 may become the next target of attention, and then the market's attention will turn to the $3400 target set by Crypto Patel.
Range volatility scenario: Ethereum prices may continue to trade between recent lows and the low $2000 region as buyers and sellers compete for control.
Bear scenario: A break below recent support levels in the high $1000 region may expose lower support areas formed in the pre-cycle phase.
The trend over the next three to six months may depend more than just on chart shape. Broader market conditions, investor risk appetite, Ethereum network activity, pledge demand, Layer 2 adoption rates and the development of major protocols may all affect the next major trend.
Frequently Asked Questions
How much will an Ethereum be worth by 2030? Independent financial forecasts suggest that by 2030, the value of 1 Ethereum (ETH) could range from a conservative estimate of $2200 to more than $40000 in a highly bullish scenario. Although predictions vary among asset managers and algorithmic models, there is a strong consensus that a reasonable baseline value for each token is between $8000 and $12000.
Will Ethereum reach US$100,000 by 2040? Most realistic predictions for Ethereum in 2040 fall between $10000 and $20000, rather than extreme six-digit predictions.






















