
 Exchange Ranking
 Top Exchanges
 24h Volume Ranking
 Popularity Ranking
 Exchange BTC Balance
 Proof of Reserves
 Decentralized Exchanges
 Funding Rate
 Funding Heatmap
 Liquidation Data
 Max Pain
 Long/Short Ratio
 Whale L/S Ratio
 Binance/Okex/Huobi L/S
 Bitfinex Margin L/S
 ETF Tracker
 Solana ETF
 XRP ETF
 Hong Kong ETF
 Bitcoin Treasuries
 Crypto Reversal
 Ethereum Reserves
 HyperLiquid Wallet Analysis
 Hyperliquid Whale Watch
 Large Transactions
 On-chain Movement
 Bitcoin ROI
 Stablecoin Market Cap
 Options Analysis
 News
News Articles
 Economic Calendar
 Features
 Wallet
 Contract Calculator


 Security
 Collections
 Watchlist
 Following
 ETH
ETH Ethereum ETF inflows reversed significantly during the week of July 13 - 17, with spot Ethereum exchange-traded funds attracting a net inflow of US$105 million, the strongest weekly performance since April. This latest figure follows a net inflow of $84 million the previous week, ending eight consecutive weeks of net redemptions and marking two consecutive weeks of positive capital flows. Data shows that under the leadership of BlackRock's iShares Ethereum Trust (ETHA), new net subscriptions have emerged in the spot Ethereum ETF market.
This latest recovery reflects short-term improvements in institutional demand, but two consecutive weeks of inflows alone are not enough to confirm a sustained trend. Ethereum is currently trading at approximately $1,933.77, with a market value of $233.33 billion, and a 24-hour trading volume of $11.98 billion. According to the latest market data, the asset has risen 3.8% in the past day.
Why is the inflow of funds from the Ethereum ETF attracting attention again?
Ethereum ETF inflows reversed two months of selling pressure and posted its strongest weekly performance since April. CoinGlass and Farside Investors reported net inflows of $105 million for the week of July 13 - 17, compared with $84 million the previous week. 
These data represent the net subscription amount after deducting redemption, rather than the total purchase amount, so they reflect the overall flow of investors 'funds into the fund, rather than the total amount of ETH purchased on-chain. Positive capital flows for the second consecutive week reinforced the recent reversal. However, the current recovery only represents an improvement in institutional demand and cannot yet confirm a shift in long-term allocation.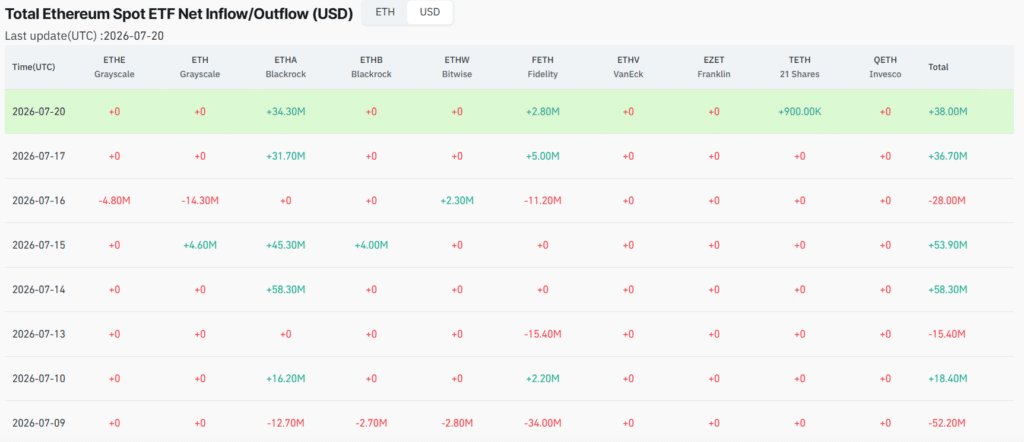
How did BlackRock's ETHA lead to recovery?
BlackRock's ETHA was the largest contributor during the reporting week. Wu Blockchain quoted SoSoValue data as reporting that on July 15, the U.S. spot Ethereum ETF attracted a net inflow of US$53.83 million. During the same trading session, ETHA contributed a net inflow of US$45.29 million, becoming the largest single contributor on the day. 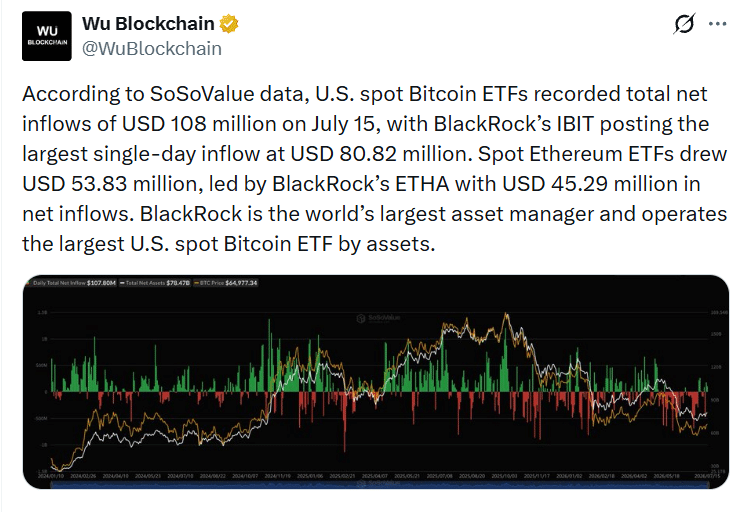
The report also pointed out that BlackRock is the world's largest asset management company, and the size of the U.S. spot Bitcoin ETF it manages also ranks first in its kind. Other funds flow tracking platforms such as BingX showed that ETHA led the majority of positive daily funds flows throughout the reporting period. BingX also reported the overall Ethereum ETF market and cumulative data for ETHA.
These cumulative data are based on different provider methods and measurement frameworks and should therefore be regarded as independent reference points rather than directly comparable numbers. Concentration of funds in one fund also brings significant risks. If demand for ETHA weakens or capital outflows occur again, the overall Ethereum ETF class may resume net redemption faster than if funds were spread across multiple issuers.
How can ETF purchases support Ethereum prices?
The inflow of funds from Ethereum ETF continues to affect the market structure of Ethereum, because for every new ETF share, the fund needs to purchase spot ETH as support. During the reporting week from July 13 to 17, Ethereum traded at approximately US$1845, with the US$1800 to US$1900 range being a key demand area where buying entered repeatedly. 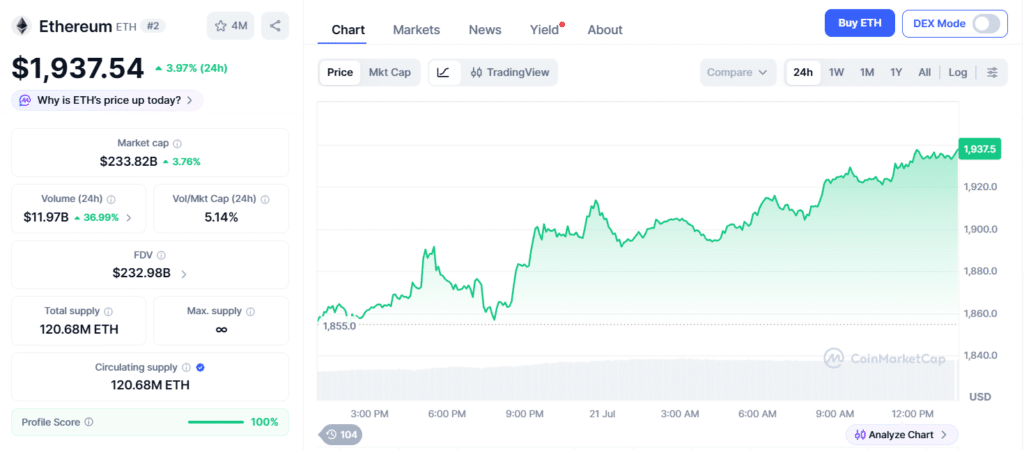
Since then, Ethereum has strengthened further and is currently trading at approximately US$1,933.77, still above this important support area. Weekly net inflows range from $80 million to $105 million, providing a stable source of buying demand that was missing during the previous eight-week redemption period.
Although ETF subscriptions are not directly converted into total purchases on the chain, continued positive net inflows can still provide structural support by gradually increasing demand for spot ETH. If a net outflow occurs again, it will weaken some of the mechanical buying support and put more pressure on the $1800 level.
Ethereum is approaching key technology levels. What are traders paying attention to?
Technology traders continue to focus on whether Ethereum can maintain its improved market structure while ETF demand remains positive. Cryptocurrency analyst Daan Crypto Trades said that $1750 is a key level that bulls need to guard. He pointed out that the level was a February low and also formed part of the structure of higher lows before Ethereum surged in 2025.
In a follow-up post shared on July 20, Daan said that Ethereum once again converted the $1750 level from resistance to support, and said this was the first time the asset had regained its previous shift from support to resistance in a broader downtrend. He added that the structure was similar to the trend before the 2025 rally, but warned that "a similar situation is definitely not expected."
The analyst also pointed out that if bullish momentum continues, the next major resistance level is $2100. These observations are consistent with improving ETF demand, but should be seen in the context of broader market conditions rather than as confirmation of a new bull cycle.
Can the latest recovery confirm lasting institutional trends?
Ethereum ETF inflows have reached their strongest weekly level since April, but current activity is still below the larger inflows recorded in 2024 and early 2025. The shift from eight consecutive weeks of net redemptions to two consecutive weeks of net inflows of US$84 million and US$105 million, respectively, indicating a recovery in institutional demand in the short term.
At the same time, most of the new funding remains concentrated in ETHA, leaving the entire category dependent on the continued strength of a single dominant product. Fund flow patterns in other crypto ETF classes do not reflect Ethereum's recent recovery, suggesting that the improvement remains asset-specific rather than a broader industry shift. 
A more sustained trend may require continued net inflows at current levels or higher in the next few weeks, broader participation of multiple ETF issuers, and continued growth in asset management. On the other hand, another net outflow from ETHA, another prolonged redemption period, or a broader market sell-off driven by macro factors will weaken the current recovery narrative.
Conclusion
Ethereum ETF capital inflows will remain one of the key indicators to measure whether the recent reversal has developed into a stage of sustained institutional accumulation. If weekly net inflows continue to approach the recent range of US$80 million to US$105 million, and participation expands beyond single issuers, confidence in recovery will be further strengthened. Continued stability above the $1800 support zone will also consolidate the current market structure.
However, if the inflow rate slows significantly, or if there is another net outflow from ETHA, the ETF-driven buying support seen in the past two weeks may weaken. The coming weeks are expected to provide clearer signals as to whether recent improvements are developing into continued institutional demand or a temporary recovery after a long redemption period.
Glossary
Ethereum ETF Fund Inflows: Funds flowing into spot Ethereum ETF.
Net redemption: Investors withdraw more than new investment.
Asset Management Size (AUM): Total assets managed by the fund.
BingX: A cryptocurrency exchange and market data platform.
Fund flow: The flow of funds in and out of investment funds.
FAQs on Ethereum ETF fund inflows
How much did Ethereum ETF fund inflows last week?
Ethereum ETF inflows reached US$105 million during the week of July 13 - 17.
Why does ETHA attract attention?
ETHA received the largest share of Ethereum ETF inflows in the same week.
Is the outflow trend over?
Yes, two consecutive weeks of positive inflows ended the previous eight consecutive weeks of capital outflows.
What price levels do traders pay attention to?
Many traders are focusing on Ethereum's $1800 support level.
What may strengthen Ethereum's recovery?
More weeks of stable ETF inflows may strengthen Ethereum's recovery.






















