
 Exchange Ranking
 Top Exchanges
 24h Volume Ranking
 Popularity Ranking
 Exchange BTC Balance
 Proof of Reserves
 Decentralized Exchanges
 Funding Rate
 Funding Heatmap
 Liquidation Data
 Max Pain
 Long/Short Ratio
 Whale L/S Ratio
 Binance/Okex/Huobi L/S
 Bitfinex Margin L/S
 ETF Tracker
 Solana ETF
 XRP ETF
 Hong Kong ETF
 Bitcoin Treasuries
 Crypto Reversal
 Ethereum Reserves
 HyperLiquid Wallet Analysis
 Hyperliquid Whale Watch
 Large Transactions
 On-chain Movement
 Bitcoin ROI
 Stablecoin Market Cap
 Options Analysis
 News
News Articles
 Economic Calendar
 Features
 Wallet
 Contract Calculator


 Security
 Collections
 Watchlist
 Following
 ETH
ETH TL; DR
directory
TL; DR
Ethereum tests important resistance areas in history
Futures traders remain optimistic, However, trading volume explains different situations.
Weak capital inflows may limit further gains.
Channel resistance remains a key observation level.
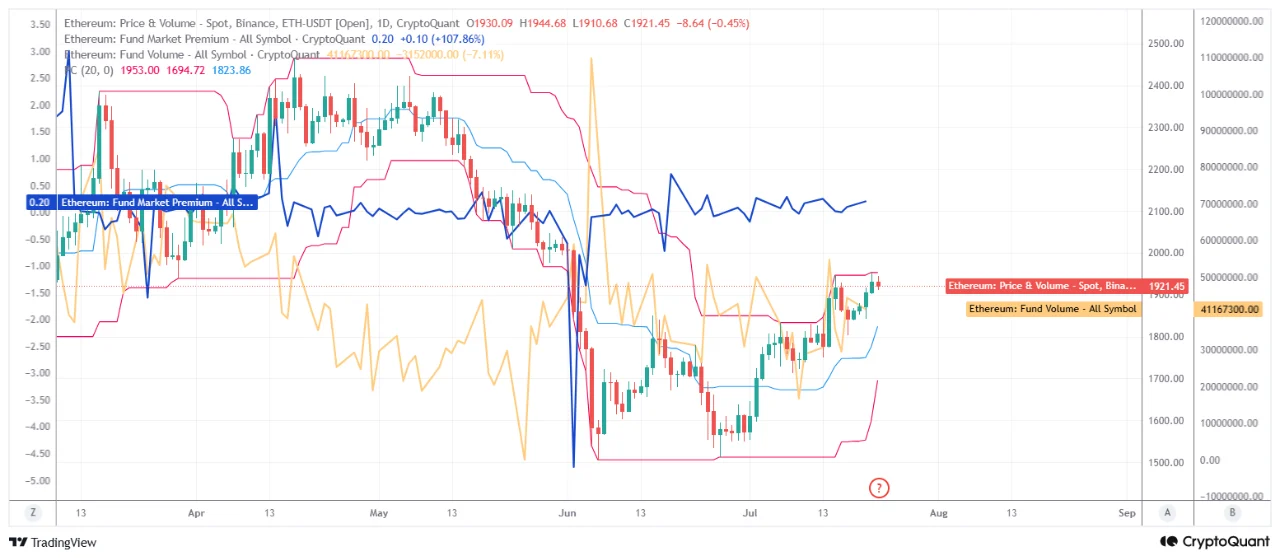
Ethereum is currently trading at close to US$1,920 and is testing the upper boundary of its price channel.
After hitting this resistance level previously, both profit-taking and short-term corrections occurred.
The funds market premium remains positive, indicating that futures traders are still holding some bullish positions.
Capital trading volume has not increased significantly, indicating that this round of rebound lacks strong new capital inflows.
Ethereum's recent recovery may be approaching a critical turning point-the world's second-largest cryptocurrency is testing an important level of technical resistance in the absence of support from strong capital inflows.
The latest CryptoQuant chart shows that the spot trading price of Ethereum on the coin is approximately US$1,920, which is close to the upper boundary of its price channel. Historically, this level has triggered profit-taking and short-term corrections many times. While derivatives traders remain moderately optimistic, indicators on the chain suggest that the current momentum for the rally may be weakening.
ETH/USD Chart| Source: CryptoQuant
Analysts pointed out that resistance on the upper edge of the channel combined with weak capital volume increases the possibility of a downward correction unless buyers enter with new liquidity.
Ethereum tests historically important resistance areas
Ethereum has steadily recovered from recent lows, regaining most of the losses it lost during the sharp sell-off in June. However, the latest price movements have brought ETH back into a technical area-an area that has repeatedly served as a ceiling in previous rallies.
This analysis uses the Binance ETH-USDT spot market as the main reference. As Binance remains the exchange with the largest volume of spot and derivatives trading, its prices are widely regarded as one of the clearest reflections of supply and demand in the overall market.
The chart shows that whenever Ethereum previously touched the upper boundary of the price channel, buying momentum subsided and sellers emerged and locked in profits. As ETH approaches the same level again, traders are watching closely to see if history repeats itself.
Futures traders remain optimistic, but volume explains otherwise.
An encouraging sign for bulls is that the money market premium indicator is still above zero. This shows that demand in the futures market has not completely disappeared, and leveraged traders still maintain relatively positive expectations.
However, the premium alone does not necessarily mean that prices will continue to rise.
Another key indicator on the chart-capital transaction volume-shows little evidence of a significant increase in new capital entering the market. Trading volumes failed to rise significantly, suggesting that the recent recovery was driven more by existing participants than by new buyers.
In the absence of strong capital inflows, rallies tend to be more likely to collapse as buying pressure lessens.
Weak inflows may limit further gains
Market analysts typically view higher volume as confirmation that price movements have broad market support. When prices rise and volume fails to increase correspondingly, it may mean a lack of confidence in the trend.
This seems to be the case for Ethereum's rally.
Despite the steady rebound, capital trading volume has not expanded significantly, raising questions about whether this round of rally has enough momentum to break through an established resistance zone.
If new liquidity continues to remain limited, traders may be more inclined to lock in profits after Ethereum's recent rise.
Channel resistance remains a key observation level
The technical prospects still depend largely on whether Ethereum can break through the upper boundary of the price channel.
If this resistance level can be decisively exceeded with the support of increased trading volume and increased capital inflows, it will weaken the bearish outlook and may open up space for a new round of gains.
However, until then, the current pattern leans towards caution.
The suppression of historically important technical resistance levels, mild optimism in futures markets and sluggish capital inflows combine to suggest that selling pressure may emerge before Ethereum develops a sustained upward trend-as analysts predict, it may overtake Bitcoin in the distant future.
For now, traders are likely to be watching closely whether buyers can generate enough momentum to deny current technical warnings, or whether resistance areas can trigger another correction.






















