
 Exchange Ranking
 Top Exchanges
 24h Volume Ranking
 Popularity Ranking
 Exchange BTC Balance
 Proof of Reserves
 Decentralized Exchanges
 Funding Rate
 Funding Heatmap
 Liquidation Data
 Max Pain
 Long/Short Ratio
 Whale L/S Ratio
 Binance/Okex/Huobi L/S
 Bitfinex Margin L/S
 ETF Tracker
 Solana ETF
 XRP ETF
 Hong Kong ETF
 Bitcoin Treasuries
 Crypto Reversal
 Ethereum Reserves
 HyperLiquid Wallet Analysis
 Hyperliquid Whale Watch
 Large Transactions
 On-chain Movement
 Bitcoin ROI
 Stablecoin Market Cap
 Options Analysis
 News
News Articles
 Economic Calendar
 Features
 Wallet
 Contract Calculator


 Security
 Collections
 Watchlist
 Following
 ETH
ETH Ethereum hits the $2000 mark
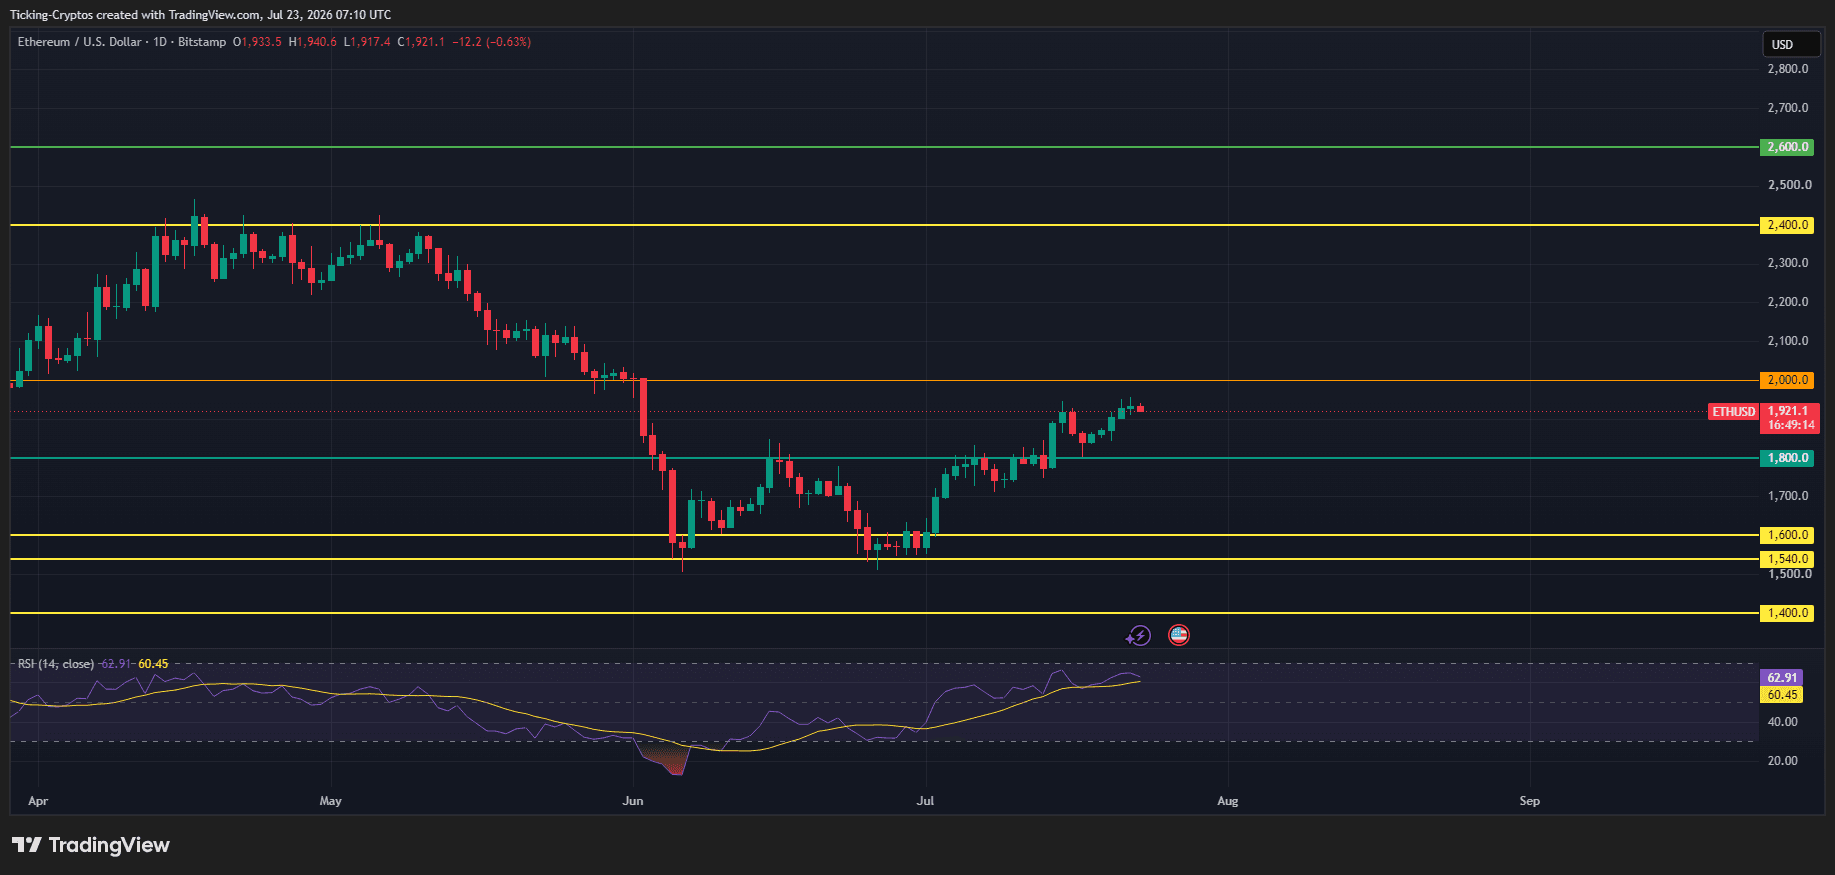
Ethereum is knocking on the $2000 door. After hitting a bottom near $1500 in June, ETH has staged one of the most constructive recoveries of the year, climbing steadily in July and trading at $1921 as of writing. The chart shows a series of clear upward highs, with the daily RSI at around 60 and continuing to move higher, confirming that momentum has clearly shifted to buyers. The key now is whether ETH can turn this momentum into an effective breakthrough in the psychological barrier of $2000.
What is the current trading price of Ethereum?
ETH's current price is about US$1921, down slightly by 0.63% during the day, but it is still firmly in the upward trend in July. This round of recovery is not an explosive rise, but an orderly progress: prices have returned to the $1800 region and continue to stabilize there, turning previous resistance into new support. The 4-hour structure shows a clear and stable upward trend throughout July-gradually rising from a low of $1450 to $1600,$1700, and $1800, and now approaching $1900-which is ETH's most constructive price structure this year. This structural shift is the fundamental difference between the current trend and the failed rebound in early 2026.
Where is the key resistance level for ETH?
The most direct battle currently is $2000 (marked in orange on the chart). This is not only a psychological integer barrier, but also a technical ceiling where selling pressure has gathered before. After the breakthrough, the next major resistance was at $2400 (marked in yellow), which continued to suppress ETH in April and May; followed by $2600 (green line). If the daily line closes above $2000, it will open the way to the $2400 area; until then, ETH is still in a recovery stage rather than a confirmed breakthrough. Broader forecasts echo this view: Long-term forecasts still point to a breakthrough of $2000 to $2500 before the end of the year, but this depends on ETF stabilization, increased liquidity and a rebound in risk appetite.
What are the downward support levels?
Downward, US$1800 is the first line of defense-ETH has just regained this level and must be held to maintain the bullish structure. After falling below, support moved downward to $1600,$1540, and finally $1400 (both marked in yellow), which roughly coincided with the panic lows in June. If the daily line closes below $1800, it will be the first warning signal that the recovery momentum will reverse in July.
Ethereum price forecast: high and low targets
Combining the chart with current momentum, the short-term scenario analysis is as follows:
Bullish target (high point):
The daily line is confirmed to close above US$2000, which will clear the way for a hit of US$2400, while the RSI still has room to enter the overbought area. As long as ETH remains above $1800, the probability of this path is higher.
Bear target (low):
If it is blocked at $2000 and then falls below the $1800 support,$1600 and $1540 will come back into view. A deeper correction will test the $1400 area again.
Analyst forecasts are generally consistent with the bullish scenario.
Ethereum's July 2026 price forecast target is US$1960, with a range of US$1718 to US$1960. Some models believe that momentum will continue into August. It is worth noting that the monthly close is of extraordinary importance here: if ETH closes above $2050 in July, some traders will target $4000 and above, and expect this cycle to hit a record high.






















