
 Exchange Ranking
 Top Exchanges
 24h Volume Ranking
 Popularity Ranking
 Exchange BTC Balance
 Proof of Reserves
 Decentralized Exchanges
 Funding Rate
 Funding Heatmap
 Liquidation Data
 Max Pain
 Long/Short Ratio
 Whale L/S Ratio
 Binance/Okex/Huobi L/S
 Bitfinex Margin L/S
 ETF Tracker
 Solana ETF
 XRP ETF
 Hong Kong ETF
 Bitcoin Treasuries
 Crypto Reversal
 Ethereum Reserves
 HyperLiquid Wallet Analysis
 Hyperliquid Whale Watch
 Large Transactions
 On-chain Movement
 Bitcoin ROI
 Stablecoin Market Cap
 Options Analysis
 News
News Articles
 Economic Calendar
 Features
 Wallet
 Contract Calculator


 Security
 Collections
 Watchlist
 Following
 BTC
BTC  ETH
ETH Ethereum (ETH) currently remains at around $1,800. If it can stand above $1,850, it is expected to challenge the $2,060 resistance level again.
Ethereum is currently trading in the US$1,882 region, down 2.33% within the day. The asset is directly putting pressure on a downtrend line that has suppressed prices for months. If this trend line is successfully broken, the market narrative will shift to a trend reversal; if it is rejected, the downward trend will remain unchanged.
The channel structure provides a more macro perspective. Ethereum recently rebounded after testing the lower boundary of the channel. As long as US$1,850 is held as a support level, the technical pattern points to a return to the upper boundary of the channel (about US$2,060). Ethereum is currently below a level that has marked many of the best long-term entry opportunities in history, hovering in historically undervalued territory, but the market has not yet fully recognized the bottom of the cycle. Panic sentiment is high, and volatility may still cause severe shocks before the real market starts.
Current net purchases exceed net sales, and whale accumulation activity suggests that large players are building positions at these levels, creating potential low-price opportunities before the market follows broadly.
Key support and resistance levels for Ethereum
The $1,870 - 1,900 area has become a key liquidity area. If prices sweep into this range, it may lay the foundation for the next wave of gains. On the downside, Ethereum prices will fall back to $1,780, while $1,730 is a deeper attraction. If it stays above $1,885, it could open the way to $1,990. After the breakthrough, the US$2,000 mark is a key relay point. A strong recovery of this position will increase the momentum of the bulls and put huge pressure on Taifang's short positions.
Ethereum Technology Outlook: Short-term momentum
Judging from recent charts, the MACD of the ETH/USDT trading pair is below the zero axis. Short-term prices have turned negative relative to long-term trends. It is worth noting that the signal line is still above the zero axis, indicating that the recent average momentum was still positive before this sudden decline. Prices are falling fast enough that they have pushed short-term momentum below the zero axis before smoother signal lines follow downward. If the signal line also falls below the zero axis, it is confirmed that the short trend is fully established.
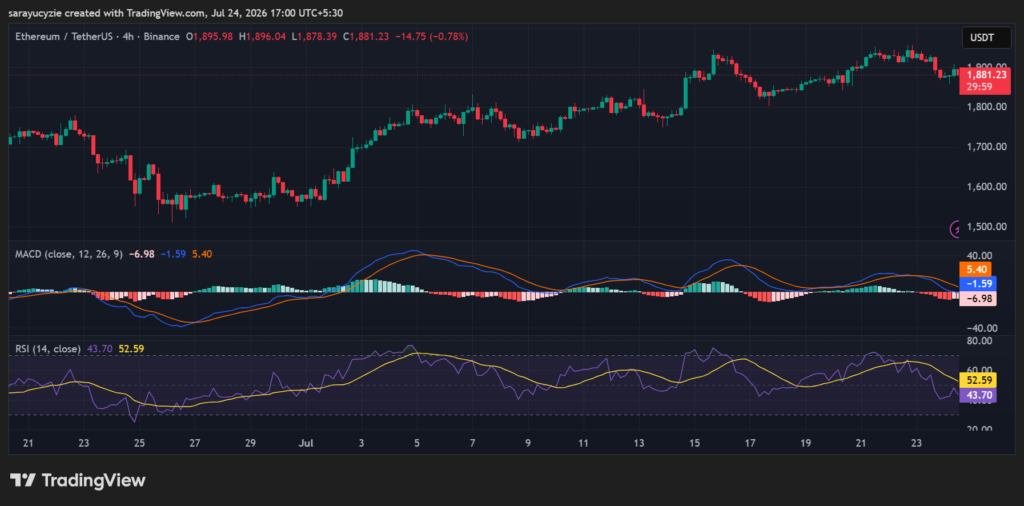
Ethereum's RSI is at 43.70, which is in a weak area, but has not yet reached oversold status. With the RSI stuck in the 40 - 50 range, sellers are currently in control of short-term price movements, but panic selling has not yet occurred. There is still room for further decline in the asset. This level usually signals a correction or slow downward consolidation in the market. Pay attention to see whether the RSI stabilizes around 40 (a position that serves as support during the standard pullback in the big cycle uptrend), or continues to slide to 30.
Highlights of the Cryptocurrency Market
Bitcoin (BTC) faces a key test: If it is rejected at resistance, will the price fall back to $64,000?






















