Exchange Ranking
 Top Exchanges
 24h Volume Ranking
 Popularity Ranking
 Exchange BTC Balance
 Proof of Reserves
 Decentralized Exchanges
 Funding Rate
 Funding Heatmap
 Liquidation Data
 Max Pain
 Long/Short Ratio
 Whale L/S Ratio
 Binance/Okex/Huobi L/S
 Bitfinex Margin L/S
 ETF Tracker
 Solana ETF
 XRP ETF
 Hong Kong ETF
 Bitcoin Treasuries
 Crypto Reversal
 Ethereum Reserves
 HyperLiquid Wallet Analysis
 Hyperliquid Whale Watch
 Large Transactions
 On-chain Movement
 Bitcoin ROI
 Stablecoin Market Cap
 Options Analysis
 News
News Articles
 Economic Calendar
 Features
 Wallet
 Contract Calculator


 Security
 Collections
 Watchlist
 Following
 STX
STX Stacks traders woke up to a chart that most people no longer cared about.
After months of continued decline in a gradually narrowing wedge pattern,$STX broke through with a series of positive bars and a volume that finally matched the moment. This Stacks price forecast focuses on the breakthrough, derivatives data and daily charts to try to reveal where $STX may go next, but does not recommend anyone to buy, sell or hold.
What is the current market capitalization and trading volume of Stacks (STX)?
According to CoinMarketCap data, STX traded at US$0.2094, up 33.76% in 24 hours. The market value reached US$380.14 million, also up about 33.75%, while the outstanding market value was US$334.65 million. 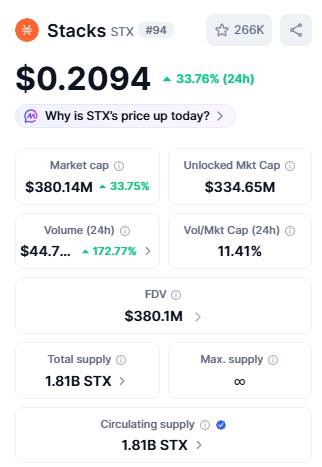 Since Stacks has no maximum supply cap, its fully diluted valuation is in line with the market value of US$380.1 million. Circulation supply and total supply are both listed as $1.81 billion STX. Trading volume jumped to $44.7 million over the past day, an increase of 172.77%, pushing the value-to-market ratio of trading volume to 11.41%, indicating that the rise was backed by real trading activity rather than a weak order book.
What do Coinglass derivatives and performance indicators show for STX?
Coinglass data adds more depth to this trend.$ STX's price performance rose 6.85% in 4 hours, 33.54% in 24 hours, 71.29% in 7 days, and 23.72% in 30 days. However, the window periods of 90 days (-15.66%), 180 days (-14.36%), year-to-date (-14.67%) and 1 year (-68.12%) are still negative, with a total historical change of-9.44%. 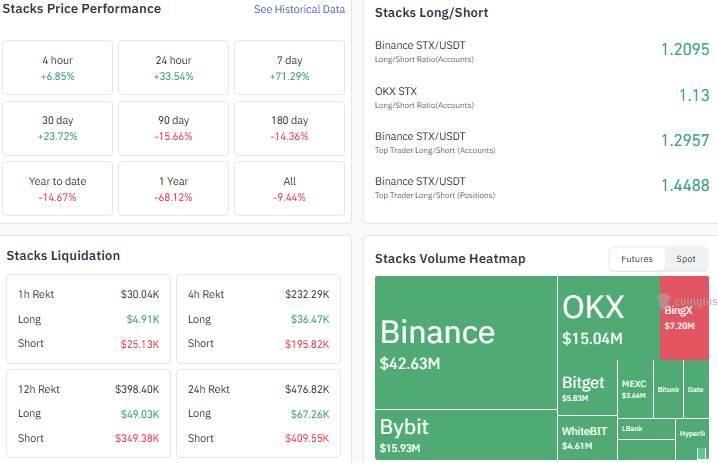 The long-short account ratio is biased towards the long side on Binance (1.2095) and OKX (1.13), while the long-short ratio for top Binance traders is even higher, at 1.2957 by account and 1.4488 by position. The amount of open positions within 24 hours reached US$476.82 million, of which short positions were US$409.55 million, far exceeding long positions (US$67.26 million).
 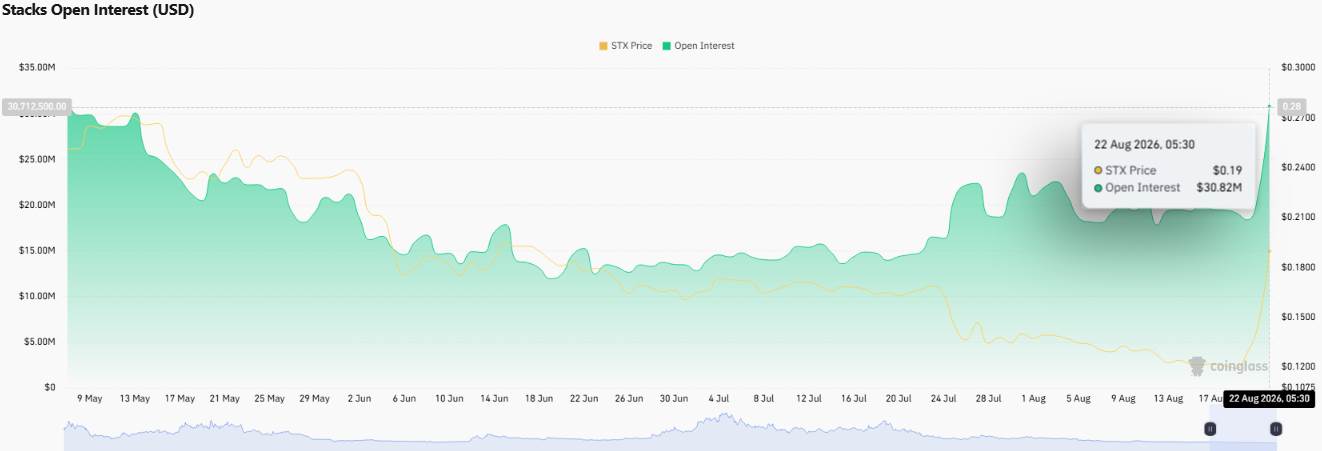 Open interest has soared to US$30.82 million with the rising market. Leading futures trading volume are Binance (US$15.93 million) and OKX (US$15.04 million).
What does STX's daily chart shape reveal?
On the daily chart of TradingView, STX has been building a declining wedge pattern for several weeks, which usually fluctuates violently once it is broken. 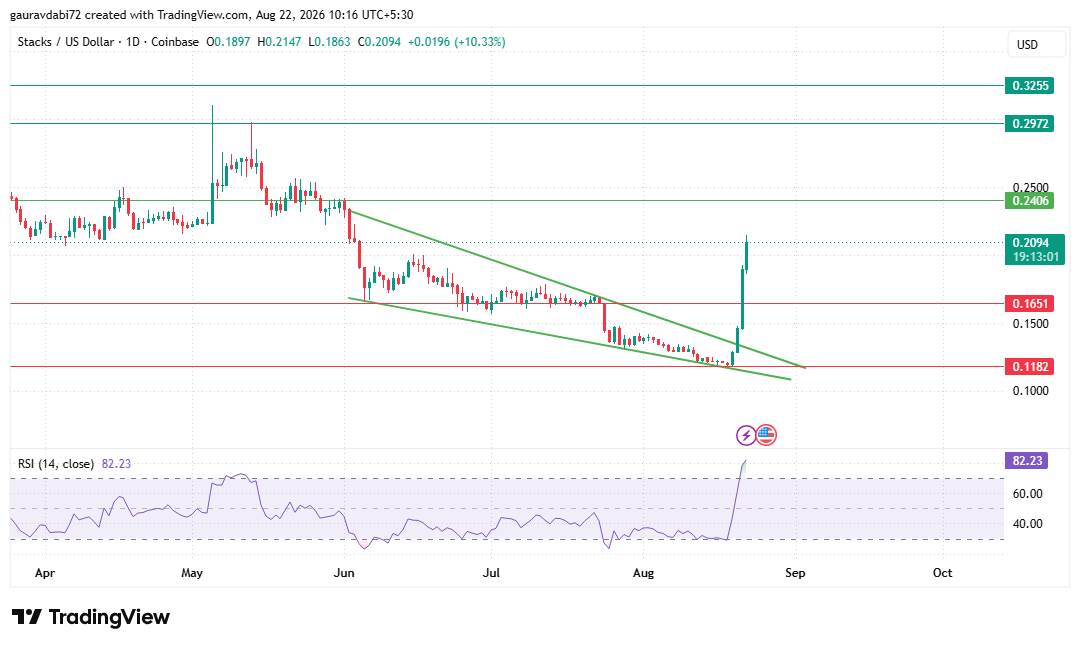 This is what just happened: $STX broke through the wedge-shaped upper trend line, backed by strong volume, and cleared resistance with a series of huge positive columns. The daily line opened at US$0.1897, hitting a high of US$0.2147, falling as low as US$0.1863, and is currently operating at US$0.2094. The 14-cycle RSI has soared to 82.23, entering deeply overbought territory, reflecting how quickly buyers have stepped in over the past few trading days.
What are the key resistance and support levels for STX?
Direct resistance is at $0.2406, which also marks the top of the recently breached wedge structure. Above that, the next resistance levels are $0.2972 and $0.3255. If buying pressure remains strong, testing the $0.3255 area may come sooner. On the downside, support and resistance levels for $STX show bottom support at US$0.1651, then US$0.1182, the lower wedge boundary that was breached. If the momentum cools down and the RSI falls back to the neutral zone,$STX may consolidate in the range of US$0.1651 to US$0.2406 before choosing the next directional move.
After this breakthrough, is STX bullish or bearish?
Market analysts pointed out that the combination of confirmed wedge-shaped breakthroughs, expanding trading volume and heavier short exposure volume suggests that STX has bullish momentum in the short term. But RSI readings above 80 also increase the risk of a correction or consolidation in the short term before the next round of gains can be ushered in. Analysts commenting on the STX price forecast added that the broader long-term (multi-month and annual) trend remains negative, meaning the current trend is seen more as an attempt at recovery in a long-term downward trend than a confirmed reversal of the trend.
What are the Stacks price forecasts in the coming weeks?
According to analysts, if current trading volume and buying momentum continue, the scenario for this $STX price forecast may move towards US$0.2406, then US$0.2972, and eventually US$0.3255 with momentum maintained. The neutral scenario is where the RSI cools down without a break, indicating that prices will consolidate between $0.1651 and $0.2406. A bearish scenario would require the daily close to fall below $0.1651 again, which would bring the $0.1182 support back into focus and cast doubt on the effectiveness of a wedge break. This Stacks price forecast is based purely on chart structure and derivative data available at the time of writing and is not a recommendation to buy, sell or hold $STX.
Disclaimer : This article is for reference only and does not constitute any financial, investment or trading advice. The cryptocurrency market is highly volatile and prices can change rapidly. Readers should conduct their own research and consult a qualified financial adviser before making any investment decisions.