Exchange Ranking
 Top Exchanges
 24h Volume Ranking
 Popularity Ranking
 Exchange BTC Balance
 Proof of Reserves
 Decentralized Exchanges
 Funding Rate
 Funding Heatmap
 Liquidation Data
 Max Pain
 Long/Short Ratio
 Whale L/S Ratio
 Binance/Okex/Huobi L/S
 Bitfinex Margin L/S
 ETF Tracker
 Solana ETF
 XRP ETF
 Hong Kong ETF
 Bitcoin Treasuries
 Crypto Reversal
 Ethereum Reserves
 HyperLiquid Wallet Analysis
 Hyperliquid Whale Watch
 Large Transactions
 On-chain Movement
 Bitcoin ROI
 Stablecoin Market Cap
 Options Analysis
 News
 Articles
 Economic Calendar
 Features
 Wallet
 Contract Calculator


 Security
 Collections
 Watchlist
 Following
 BTC
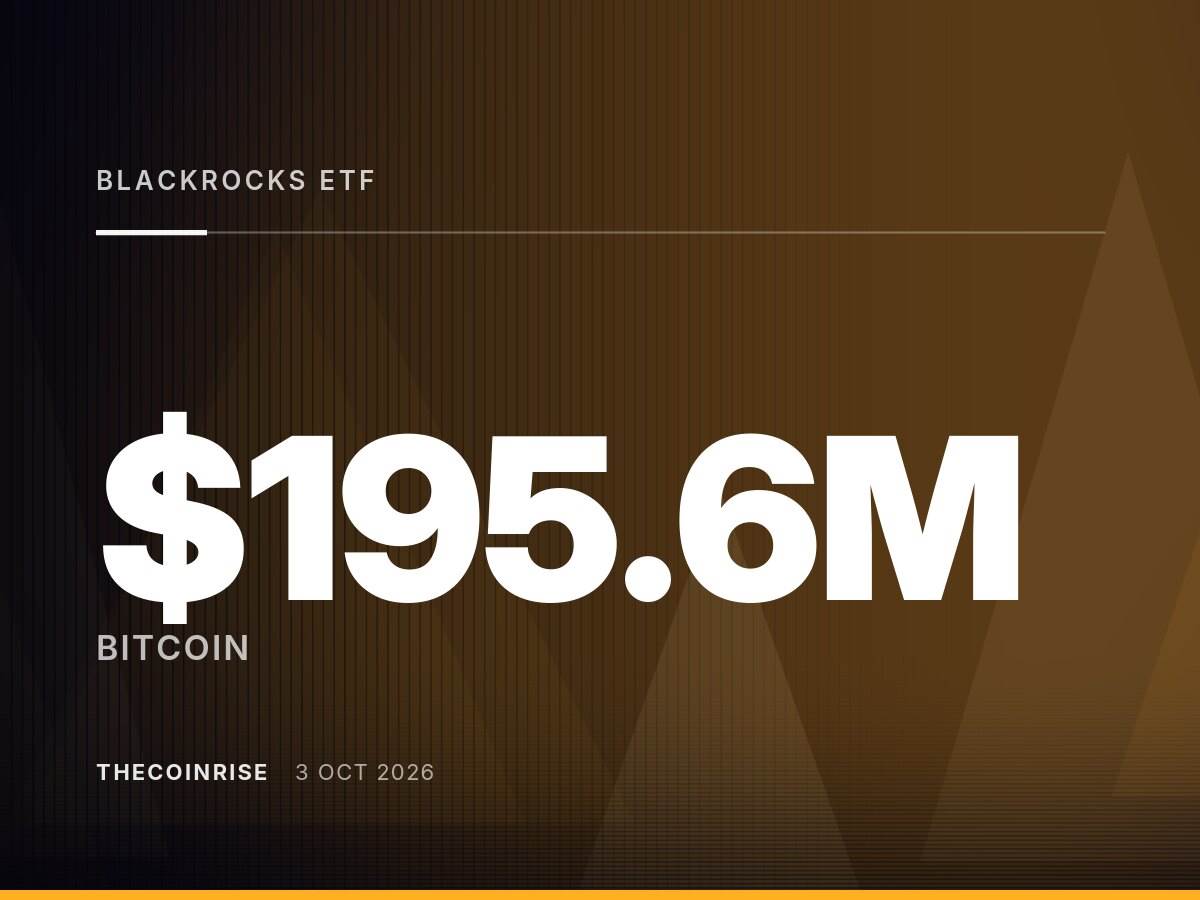
比特币巨鲸抛售超3万枚BTC,价格受阻于87,220美元后回落
核心摘要:随着比特币价格在87,220美元附近遭遇拒绝并回撤至84,575美元区域,大型持有者(巨鲸)抛售了超过30,000枚BTC。目前,82,500美元已成为关键支撑区间,布林带下轨在82,362美元附近对该区域形成强化。CoinGlass数据显示,82,600至82,800美元以及82,000美元附近存在清算聚集区。Glassnode分析指出,6至12个月前的买入者成本基准约为89,000美元,这意味着任何反弹上方都面临沉重的供应压力。
巨鲸获利了结引发市场回调
比特币在87,000美元附近的拒绝交易,使得市场焦点重新转向82,500美元。此前,在一次未能成功的突破中,大型持有者抛售了超过30,000枚BTC。10月3日,比特币在触及约87,220美元后反转,交易价格位于84,575美元附近,使价格重新回到一个为期两周的通道内。
加密货币分析师Ali Charts将此次拒绝归因于双重压力:价格触及通道上边界,同时鲸鱼持仓量下降,大型投资者正在获利了结。按每枚硬币约84,000美元计算,这30,000枚BTC的减持规模约为25.2亿美元。这种抛售行为将下一个技术关注点转移至通道底部。
30,000枚BTC的抛售令82,500美元支撑位成为焦点
Ali's technical analysis positioned the lower boundary of the channel at around $82,500. However, this level alone does not confirm that the buyer has regained control of the situation. A more important signal will be that whales begin to accumulate again after prices hit the area. An increase in large holder balances will indicate that the distribution phase has begun to reverse.
Other market data also pointed nearby support levels to the same area. The four-hour chart shows that the Bollinger Band is around $82,362. CoinGlass's clearing data also identified concentrations between $82,600 and $82,800, as well as another cluster around $82,000. These levels form a narrow support area rather than a single price point. Still, as long as the whale balance starts to increase again, the conditions set for the buy remain unmet. Taken together, market structure, clearing data and whale behavior are all concentrated in this downward region.
Rally faces selling pressure of US$89,000 cost benchmark
Even if support is maintained, Bitcoin will still face additional selling pressure above the recent rejection zone. Glassnode reports that investors who had previously bought at the top of the high market are selling as prices approach their break-even levels. The average cost benchmark for investors who bought 6 to 12 months ago was approximately $89,000, while the average cost for investors who bought 1 to 2 years ago was approximately $97,000. At current prices, both groups of investors are at a loss. Glassnode also pointed out that buyers who rebounded in 2025 are recording the highest average daily sales volume this year.
Currently, Bitcoin investors who buy at the top are selling. Two groups are underwater: the cost of buying 1-2 years ago was $97,000, and the cost of buying 6- 1 - 2 months ago was $89,000. Those who bought during the 2025 rally sold the most coins per day, while those who bought during the decline did not show the same selling behavior.
At the same time, buyers who bought in late market declines did not show the same selling behavior. That makes $87,000 an important first hurdle. The $89,000 break-even area is only about 2.3% above that level.
Research released by Glassnode on September 30 showed that realized profits for long-term holders almost doubled in the week ended September 29. Their share of total realized profits rose from 34% to 55%, further confirming evidence that mature holders are locking in earnings.
So, instant testing of BTC is not just about whether the $82,500 is solid. Confirm the need for support to remain intact while whale balances start to rise again.