Exchange Ranking
 Top Exchanges
 24h Volume Ranking
 Popularity Ranking
 Exchange BTC Balance
 Proof of Reserves
 Decentralized Exchanges
 Funding Rate
 Funding Heatmap
 Liquidation Data
 Max Pain
 Long/Short Ratio
 Whale L/S Ratio
 Binance/Okex/Huobi L/S
 Bitfinex Margin L/S
 ETF Tracker
 Solana ETF
 XRP ETF
 Hong Kong ETF
 Bitcoin Treasuries
 Crypto Reversal
 Ethereum Reserves
 HyperLiquid Wallet Analysis
 Hyperliquid Whale Watch
 Large Transactions
 On-chain Movement
 Bitcoin ROI
 Stablecoin Market Cap
 Options Analysis
 News
 Articles
 Economic Calendar
 Features
 Wallet
 Contract Calculator


 Security
 Collections
 Watchlist
 Following
 BTC
Analysts have identified $84,000 as a key resistance level. If Bitcoin closes above this level in the four-hour chart, it could potentially rise to $93,000.
The Relative Strength Index (RSI) for Bitcoin currently stands at 52.48. The negative MACD histogram indicates that as BTC approaches the resistance zone between $84,000 and $85,000, market momentum appears mixed.
Although more than 70% of the circulating supply is still profitable, analyst Darkfost reports that investors have lost nearly $685 billion in bitcoin assets, compared to only less than $400 billion in profitable assets. Meanwhile, Bitcoin is approaching the crucial level of $84,000. Analyst Ali Charts believes this could be the trigger for a rebound to $93,000.
Ali Charts considers $84,000 to be a critical level for a breakout.
Ali Charts notes that Bitcoin has previously seen an increase after holding below the lower boundary of the channel and closing above the 50-period Simple Moving Average (SMA) on the four-hour chart. This analyst believes similar technical patterns are forming, with the 50 SMA currently located near $84,000.
According to Ali Charts’ analysis, if the price can maintain a close above $84,000 on the four-hour chart, it could create room for further gains towards $93,000. However, Bitcoin must first overcome the resistance around $84,000 to $85,000. The chart shows that BTC began to recover after falling to around $81,000 at the beginning of October.
Looking at the previous trends, Bitcoin rose from around $75,500 in mid-Sepember, and reached a high of around $86,000 on September 22nd. Subsequently, it reached a peak of around $86,500 at the beginning of October, but subsequent selling pressure caused the price to fall back.
Bitcoin's recovery momentum shows mixed signals
. The RSI value for Bitcoin is 52.48, which is higher than the average signal level of 49.96. This indicator is slightly above the neutral level of 50. At the same time, the MACD line reading is 54.25, while its signal line is 33.20.
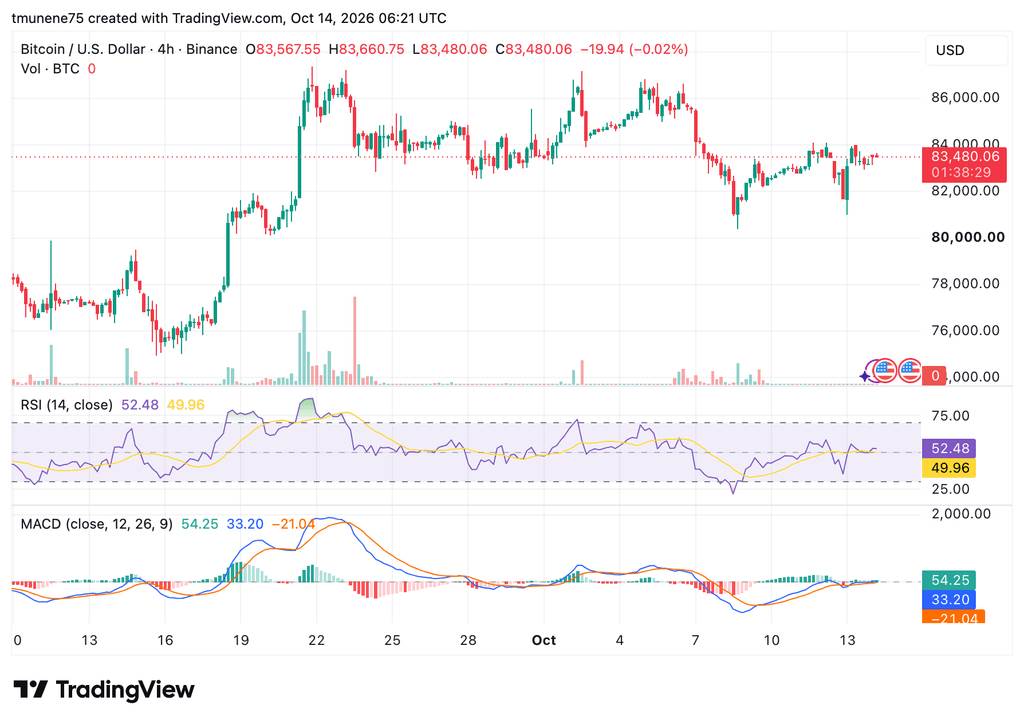
However, the MACD bar chart remains in the negative zone of -21.04, making the confirmation of momentum signals unclear. The current immediate support range is between $82,000 and $83,000, followed by $81,000 and $80,000.
If the price fails to break through around $84,000, then the low support levels between $82,000 and $80,000 will become more important. If there is a successful breakthrough, then resistance levels around $85,000 and $86,000 to $86,500 may be further tested.
Darkfost reports that Bitcoin's loss-making capital amounts to $685 billion
. According to Darkfost's report, although more than 70% of the circulating supply of Bitcoin is still profitable, the total amount of capital that is losing money is still as high as $685 billion, exceeding the currently profitable capital of less than $400 billion.
Darkfost indicates that the gap between profitable and loss-making capital is narrowing. Nevertheless, data shows that despite Bitcoin's recent rebound, investors' overall capital still tends to be in a state where no losses have been incurred.