Exchange Ranking
 Top Exchanges
 24h Volume Ranking
 Popularity Ranking
 Exchange BTC Balance
 Proof of Reserves
 Decentralized Exchanges
 Funding Rate
 Funding Heatmap
 Liquidation Data
 Max Pain
 Long/Short Ratio
 Whale L/S Ratio
 Binance/Okex/Huobi L/S
 Bitfinex Margin L/S
 ETF Tracker
 Solana ETF
 XRP ETF
 Hong Kong ETF
 Bitcoin Treasuries
 Crypto Reversal
 Ethereum Reserves
 HyperLiquid Wallet Analysis
 Hyperliquid Whale Watch
 Large Transactions
 On-chain Movement
 Bitcoin ROI
 Stablecoin Market Cap
 Options Analysis
 News
News Articles
 Economic Calendar
 Features
 Wallet
 Contract Calculator


 Security
 Collections
 Watchlist
 Following
 BTC
BTC MetaDAO: The reason behind the transition from silence chart to Solana's Twitter focus
MetaDAO's market chart suddenly jumped from calm to the center of discussion in the Solana community. This change in timing is no accident. A governance vote and a transfer of treasury funds instantly made the originally boring traders energetic. So, what has changed? Can this rally be sustained?
Is META about to break through the long-term consolidation range?
Any MetaDAO price forecast worth reading starts with the question that traders are most concerned about right now: Is this a real breakthrough or another false market? Anyone looking for MetaDAO's September 2026 price forecast wants the same answer: a clear judgment on whether the rally is sustainable.
The key is that something has finally forced the market to make a direction choice. Buyers entered the market strongly, and the trend of token prices set a new record in more than a month.
Before writing this article, we checked the weekly chart and the changes were clear at a glance. Is this momentum sustainable, or will it fade before next weekend?
$META Price Today: Current Price
As of 06:31 UTC on August 25, 2026, according to market data, MetaDAO ($META) trading price is approximately US$6.93, an increase of approximately 43.7% in 24 hours. The 24-hour price range is $4.86 to $7.68.
Immediate resistance is around $7.90 and key support is around $4.91. As long as META remains above the support area, the basic scenario is bullish; however, if it falls below this level, the market pattern will quickly reverse.
Why did MetaDAO prices rise today?
It turns out that this rally has a real catalyst rather than random fluctuations.$ The META community promoted the passage of proposal META-040, and the market quickly noticed this trend.
Based on the passage of Proposal META-040,$META Treasury will convert US$2 million in USDC to USDv. This move was originally proposed a few days ago through the agreed decentralized governance process, which can be viewed in the governance announcement.
In launch board tokens governed by futurism, treasury decisions are a direct signal of market confidence. Traders view active treasury management as a sign that the project is still actively operating.
$META Data Overview
This MetaDAO price forecast is based on data rather than market sentiment. The following is an overview of the data:
Market Value: approximately US$160.2 million
24-hour Trading Volume: approximately US$29.77 million
Circulation and Total Supply: 22.685 million META
Maximum Supply: Uncapped
Historical High Price: US$10.84 (October 21, 2025), currently down 34.9% from the peak
Historical low: US$0.7244 (August 17, 2025), up 874.9% since then
These data are derived from real-time MetaDAO price information.
$META Technical Analysis: 4-hour and weekly chart analysis
4-hour chart analysis:
Looking at the shorter term 4-hour chart, META broke through the channel that restricts price decline throughout August. After breaking through the K line penetrated resistance, the trading price stabilized around $6.96.
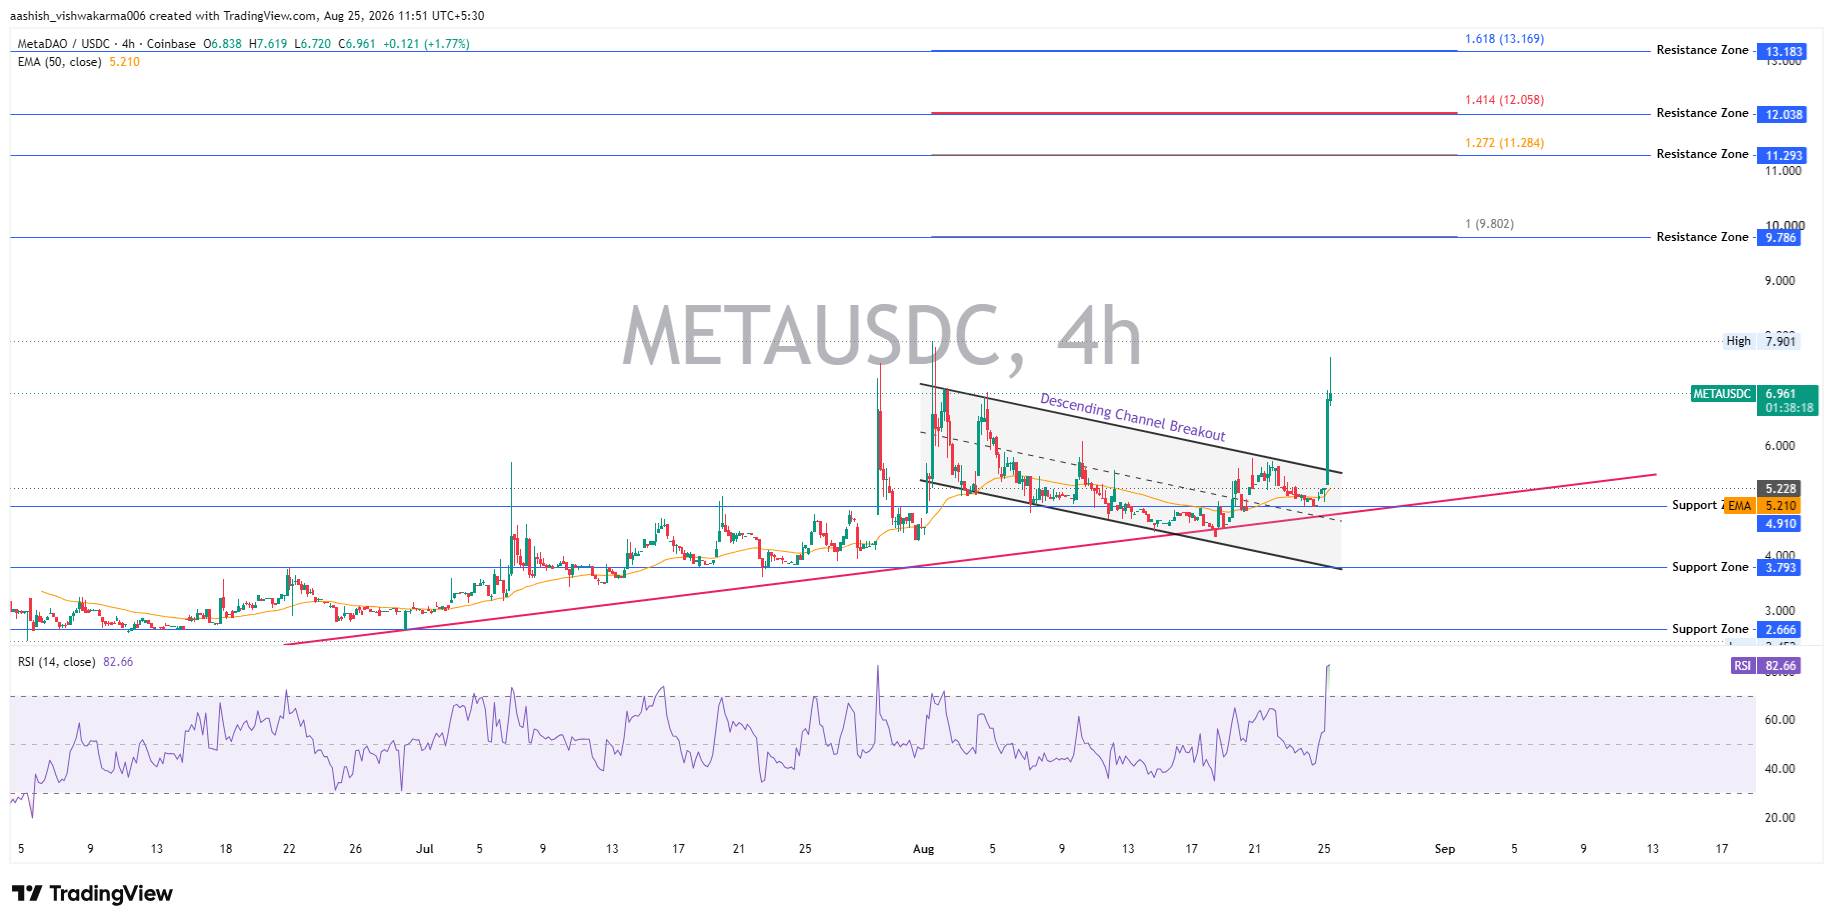
The RSI indicator reading on the 4-hour chart is 82.66, which is in the overbought area. This in itself is not a red flag, but it means that a short-term correction is more likely, even in a healthy uptrend.
Weekly chart analysis:
Weekly chart structure shows that an upward channel has formed since June. The week's opening price was US$5.055, hitting a high of US$7.619, and then stabilized around US$6.90, with an increase of nearly 36.58% this week.
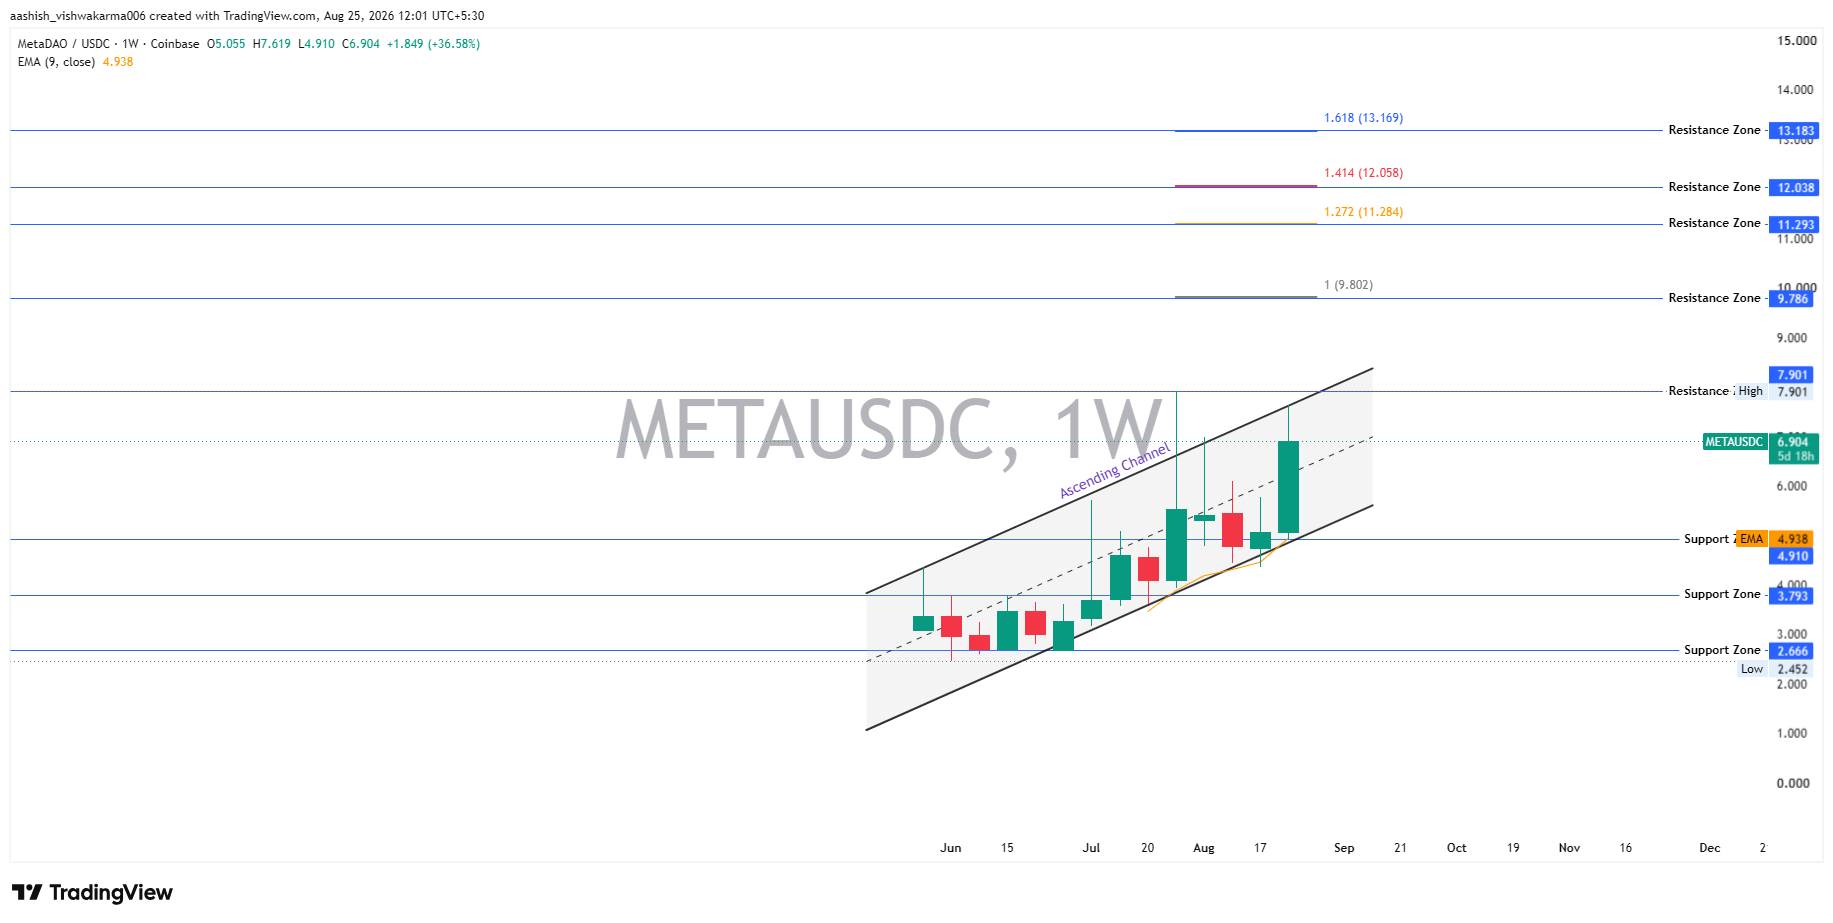
This is a decisive weekly K-line. The nine-cycle EMA is at around $4.938, well below current trading levels, indicating momentum is in favor of buyers during this time frame.
Key support and resistance levels:
Resistance levels are ranked above the current price: US$7.90, US$9.79, US$11.29, US$12.04 and US$13.18, and are based on recent fluctuations in the Fibonacci expansion area. Support was at $4.91 (close to the weekly EMA), followed by $3.79 and $2.67. If the price falls below $4.91 in 4 hours, it will weaken the short-term structure.
$META whale concentration and holder risk
Let's talk about what traders often overlook.
Holder data shows that the top ten wallets hold 39.89% of the supply, worth approximately US$62.72 million. Whale wallets only account for 0.6586% of the total number of holders, but control 66.23% of the supply.
This concentration is very high. The 47 whale addresses hold 65.7% of the circulating supply. The total number of holders is 6158, a small base for a project with a market value of $160 million. Concentrated ownership means that once a few wallets sell off, liquidity can quickly disappear.
MetaDAO price forecast: bearish, benchmark and bullish scenarios
The following is a breakdown of this $META price forecast over three time frames, of which the 30-day window falls exactly in September 2026.
Time Frame: 7 Days
Bearish Scenario: $4.91
Baseline Scenario: $6.50 - $7.90
Bullish Scenario: $9.80
Probability: BEAR 25% /BASE 50% /BUY 25%
FAILURE CONDITION: TRADE PRICE BELOW $4.91
TIME FRAME: 30 DAYS
BEAR SCENARIO: $3.79
BASE SCENARIO: $7.90 - $9.80
BUY SCENARIO: $11.29
Probability: Bearish 30% /Benchmark 45% /Bullish 25%
Expiration Condition: Weekly Close Below $3.79
Timeframe: Early 2027
Bearish Scenario: $2.67
Benchmark Scenario: $9.80 - $12.04
Bullish scenario: $13.18
Probability: bearish 30% /benchmark 40% /bullish 30%
Failure condition: Loss of upward-channel support
Altcoin market background: MetaDAO in Solana launch board tokens
MetaDAO is not a trend-chasing mein. It operates as a Solana start-up token built on a futuristic governance mechanism, with the market, rather than a simple vote, determining treasury actions.
This framework is critical to this MetaDAO price forecast, as the trading price of launch board tokens fluctuates with the narrative cycle associated with new project launches and governance activities. However, news from the broader altcoin market will still set the tone. When Bitcoin's dominance declines, tokens such as META tend to perform better. Traders trading launch board tokens will also pay attention to exchange listing news to find new liquidity catalysts. Scheduled governance votes will also be displayed on the cryptocurrency event calendar.
What factors may invalidate this MetaDAO price forecast
A four-hour trading break below $4.91 would break the rising channel and open the channel for a fall back to $3.79. Please pay close attention to this price. Regulatory changes are equally important. This year, the EU's MiCA enforcement action against unregistered platforms has reshaped the liquidity landscape of small tokens. Fed policy also plays a role, as its policy outlook tends to affect the risk appetite of all altcoins, including META. Regulatory clarity in the United States is also crucial. Pending progress on the Clarity Act may change the way launch board tokens are handled in the future. Whale selling remains the biggest variable. If concentrated holders start taking advantage of the rally to distribute, the bullish argument will quickly fade.
Disclaimer : This article is for information purposes only and does not constitute financial, investment or trading advice. The cryptocurrency market is extremely volatile and prices can change rapidly. Be sure to do your own research and consult a licensed financial adviser before making any investment decisions.