Exchange Ranking
 Top Exchanges
 24h Volume Ranking
 Popularity Ranking
 Exchange BTC Balance
 Proof of Reserves
 Decentralized Exchanges
 Funding Rate
 Funding Heatmap
 Liquidation Data
 Max Pain
 Long/Short Ratio
 Whale L/S Ratio
 Binance/Okex/Huobi L/S
 Bitfinex Margin L/S
 ETF Tracker
 Solana ETF
 XRP ETF
 Hong Kong ETF
 Bitcoin Treasuries
 Crypto Reversal
 Ethereum Reserves
 HyperLiquid Wallet Analysis
 Hyperliquid Whale Watch
 Large Transactions
 On-chain Movement
 Bitcoin ROI
 Stablecoin Market Cap
 Options Analysis
 News
News Articles
 Economic Calendar
 Features
 Wallet
 Contract Calculator


 Security
 Collections
 Watchlist
 Following
 LINK
LINK A whale transferred 984,550 LINKS to Coinbase, worth approximately US$9.23 million, after accumulating 2.41 million LINKS from Binance. LINK prices broke through the 50-day moving average (US$8.71) and the 200-day moving average (US$8.44), strengthening the technical side. LINK currently faces resistance around US$9.40 -9.50, while US$8.71 and US$8.44 are still key support levels for this rally.
Chainlink is facing new whale activity, with LINK trading around $9.39 after breaking through the key moving average. Onchain Lens reported that a whale sent 984,550 LINKS to Coinbase, worth approximately $9.23 million. Prior to the transfer, the whale had accumulated approximately 2.41 million LINK from Binance in the past month.
The whale sent nearly 1 million LINKS to Coinbase
The whale still holds approximately 1.43 million LINKS, worth approximately US$13.43 million. Onchain Lens estimates unrealized profits on the remaining positions of approximately $1.42 million. At the same time, Michael van de Poppe pointed out that LINK has exceeded the moving average in higher time frames. He also mentioned a huge bullish divergence on the asset. According to van de Poppe, this trend could mark the end of LINK's four-year downward trend. However, he said traders should avoid chasing gains.
His first scenario is for Bitcoin to reach the bottom slightly, but not to fall significantly to $61,000. Under this scenario, he predicts that LINK may first fall below $9.20 and then hit $11.
LINK breaks key moving average
The chart shows that LINK traded around $9.392 on August 16. Prices have recently climbed from the US$8.20 -8.50 region and exceeded the 50-day moving averages and 200-day moving averages. The 50-day moving average is at $8.71, and the 200-day moving average is at $8.44. 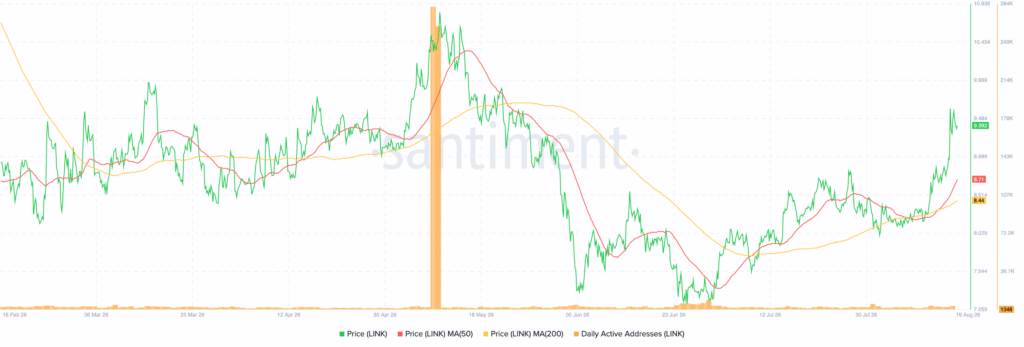
Source: Sanitation
According to the chart, both moving averages have begun to turn upward. However, LINK had previously fallen from nearly $10.90 in early May to the $7.20 -7.30 region in June. The price then reached a higher low and broke through $8.70.
Internet activity is still below its peak in May
The number of daily active addresses has dropped significantly from a peak of around 284,000 in early May. Despite the recent rebound in LINK prices, the latest reading is around 1,346. van de Poppe also outlined the second scenario, a market decline. He said he would focus on areas below $8.60 to look for trading opportunities where Link might move towards $11. The chart shows support at $8.71 and $8.44, followed by $8.00-$8.20. Resistance is around $9.40 -9.50, then $10.00 and $10.45 -10.90.