Exchange Ranking
 Top Exchanges
 24h Volume Ranking
 Popularity Ranking
 Exchange BTC Balance
 Proof of Reserves
 Decentralized Exchanges
 Funding Rate
 Funding Heatmap
 Liquidation Data
 Max Pain
 Long/Short Ratio
 Whale L/S Ratio
 Binance/Okex/Huobi L/S
 Bitfinex Margin L/S
 ETF Tracker
 Solana ETF
 XRP ETF
 Hong Kong ETF
 Bitcoin Treasuries
 Crypto Reversal
 Ethereum Reserves
 HyperLiquid Wallet Analysis
 Hyperliquid Whale Watch
 Large Transactions
 On-chain Movement
 Bitcoin ROI
 Stablecoin Market Cap
 Options Analysis
 News
News Articles
 Economic Calendar
 Features
 Wallet
 Contract Calculator


 Security
 Collections
 Watchlist
 Following
 BTC
BTC  ENA
ENA  ETH
ETH  HYPE
HYPE  TRUMP
TRUMP  ZEC
ZEC  LIT
LIT  PUMP
PUMP The core logic of the cryptocurrency market closing strongly in August lies in the key breakthrough on August 19.
The cryptocurrency market ended with a strong upward trend in August, but the real story of this rebound is not just reflected in the price figures, but hidden in the structural market breakthrough that occurred on August 19. As the U.S. Treasury Department announced an increase in the repurchase of long-term treasury bonds, Treasury yields fell and the US dollar weakened. Investors who had expected a decline were forced to stand on the opposite side of the market. As a result, approximately $2.7 billion in short positions were forcibly closed within 24 hours.
This chain reaction pushed Bitcoin past the $70,000 mark and then beyond $75,000. As of August 27, Bitcoin hit a high of US$80,264, and finally completed August transactions at a level of approximately US$78,000. Ethereum's performance was equally impressive, soaring from $1,916 on August 18 to $2,515 in just three days.
What turned the market around?
In the early stages of this rally, the U.S. Treasury market played a crucial role. Previously, the 30-year Treasury yield climbed to 5.337%, the highest level since 2007, while total federal debt also exceeded the US$40 trillion mark.
However, the next day, the Ministry of Finance announced that it would increase the amount of each repurchase of long-term treasury bonds from US$2 billion to at least US$4 billion, and plans to implement it on September 9. The market interpreted the move as a sign of liquidity support. As long-term yields fell, the U.S. dollar index fell against all G10 currencies.
This macro environment has prompted investors to re-examine the theory that scarce assets are more attractive in a devaluing environment. Gold was the first to benefit as the first stop in this narrative, and the cryptocurrency market, which had previously lagged behind other risky assets throughout 2026, also provided new space for capital rotation.
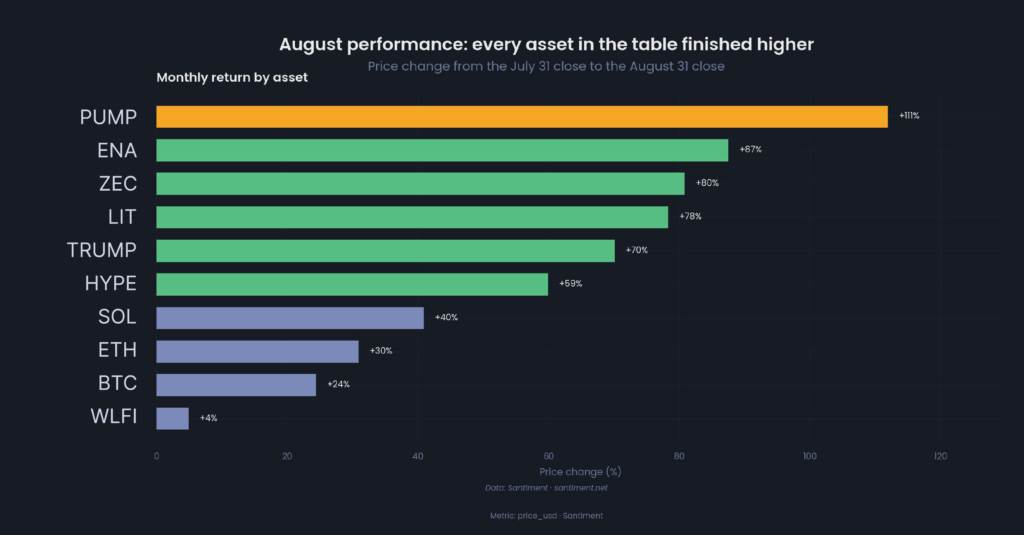
Market performance in August clearly reflected this change: PUMP rose 111%, ENA rose 87%, TRUMP rose 70%, and Bitcoin gained 24%. In contrast, assets with smaller market capitalizations responded more violently to changes in liquidity and speculative demand.
Bitcoin rises, where are the investors?
Although Bitcoin rose 24% in August, the popularity of social media discussions only increased by about 6%. The average number of daily mentions increased from 2,355 to about 2,500. More importantly, the weighted market sentiment index remained near zero for most of the rebound, and turned negative again on August 26.
According to Sand, the seven-day average sentiment index peaked at around +0.020 on August 25. However, this level is quite sluggish compared to the market attention accompanying such strong price fluctuations.
This lack of attention is mainly explained by forced short liquidations. Data shows that prices can still be pushed higher even without a large influx of new investors. A similar situation occurred in the Ethereum market: ETH's weighted sentiment index fell to a three-month low on August 17, and began to rise sharply just two days later.
It can be seen that the rebound in August did not present the classic "all admission" scene. Market attention has not spread widely, but has shifted rapidly between different assets.
Which tokens did the funds flow to?
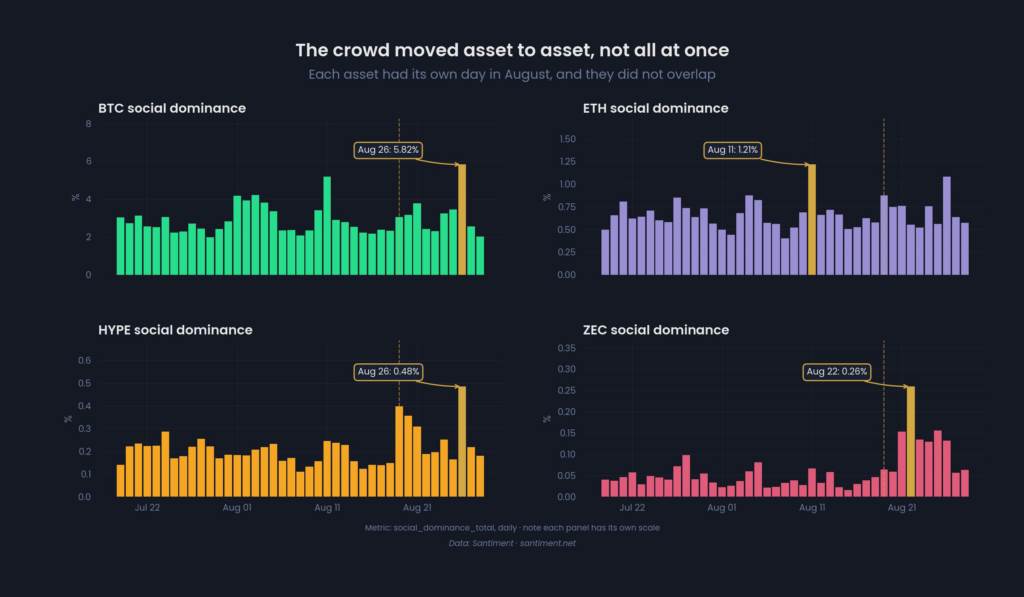
Social media dominance data clearly reveals this funding rotation path. During the 10-day window after August 19, Zcash's social media dominance was 183% higher than its own pre-rebound average, and Hyperliquid was 44% higher. During the same period, Bitcoin's growth was approximately 12%, and Ethereum's growth was 8%.
The peak on different dates further supports this trend: Ethereum's attention peaked on August 11, Zcash peaked on August 22, and Bitcoin and Hyperliquid peaked on August 26.
Meme coins have become one of the most active sectors in this round of rotation. PUMP rose 111%, and Meme coin trading activity on Robinhood Chain accelerated. The craze has also spread to the Solana ecosystem, with Lighter's native token LIT achieving an increase of approximately 78% in August.
Solana itself rose nearly 40%, closing at around $103 at the end of the month. However, social media attention for Solana itself has not increased significantly at the same time. On August 19, the number of mentions was 289, on August 21, it was 244, and as early as August 12, the number was as high as 490. This suggests that the rising market narrative mainly revolves around Solana-related Meme coins rather than directly pointing to SOL itself.
Reduction in Ethereum Exchange inventory signals
In addition to price fluctuations, another signal on the Ethereum chain has also attracted market attention. The number of ETH on the exchange decreased from approximately 7.69 million on June 3 to 6.28 million on August 27, a decrease of approximately 1.4 million, accounting for 18%.
It is worth noting that withdrawals continue even during the price increase. After August 19, about 275,000 ETH pieces were withdrawn from the exchange, causing the exchange balance to fall to the lowest level during the observation period.
Large wallet addresses have also seen significant changes. Addresses holding more than 1,000 ETH decreased by approximately 1.7 million ETH between May 20 and August 20; while the proportion of small group holdings holding 1-10 ETH increased from 4.38% to 4.52%. However, only about 300,000 of these 1.7 million ETH have flowed into small wallets, and the rest may have been diverted to pledge contracts or smart contract addresses.
September Outlook: The core issue
Other developments in the last week of August suggest that the rally is not limited to short-term short covering.
Strategy spent US$369.7 million to acquire 4,603 BTC in its first Bitcoin purchase since June, with an average purchase price of US$80,318. The company holds a total of 845,050 bitcoins, and the average cost remains at US$75,412.
On the other hand, most of the strongest gains in August were driven by a specific narrative. Zcash rose 80% before the ETF launch, ENA rose 87%, and HYPE rose 59%. Zcash's social media attention peaked before the ETF was officially traded and quickly returned to normal levels.
This phenomenon more accurately describes the nature of the August market: the cryptocurrency market rose overall, but funds and attention were not evenly distributed. As liquidity expectations change and emerging narratives emerge, capital continues to flow between different assets.
The key in September is whether this rotation will attract new investors to expand their participation. Because of the biggest rebound in August, it seems that the entire market has not yet been fully convinced.
The content of this article is based on general market data and does not constitute investment advice. Readers are advised to conduct independent research.