Exchange Ranking
 Top Exchanges
 24h Volume Ranking
 Popularity Ranking
 Exchange BTC Balance
 Proof of Reserves
 Decentralized Exchanges
 Funding Rate
 Funding Heatmap
 Liquidation Data
 Max Pain
 Long/Short Ratio
 Whale L/S Ratio
 Binance/Okex/Huobi L/S
 Bitfinex Margin L/S
 ETF Tracker
 Solana ETF
 XRP ETF
 Hong Kong ETF
 Bitcoin Treasuries
 Crypto Reversal
 Ethereum Reserves
 HyperLiquid Wallet Analysis
 Hyperliquid Whale Watch
 Large Transactions
 On-chain Movement
 Bitcoin ROI
 Stablecoin Market Cap
 Options Analysis
 News
News Articles
 Economic Calendar
 Features
 Wallet
 Contract Calculator


 Security
 Collections
 Watchlist
 Following
 HYPE
HYPE Hyperliquid price forecast: The trend is accelerating and the chart takes on interesting patterns
The discussion about Hyperliquid prices is heating up again, and this time there is a really interesting pattern behind the chart. HYPE has continued to fall over the past few trading sessions, constrained by a resistance level that has repeatedly rejected price increases, and is currently launching its most determined attempt to break through to date. In addition, a review of the way new tokens are actually listed on the network-a mechanism that most traders have never been clearly explained-makes it worth considering many factors beyond price movements. The following is a complete analysis.
Hyperliquid Prices Today: Real-time Data and 24-Hour Changes
As of this writing, HYPE's trading price was US$79.79, up nearly 0.68% in the past hour. Although the overall 24-hour trend remained negative, the decline was about 4.97% after falling about $4.17 during the day. Futures volume in the past 24 hours was US$3.18 billion, while spot volume was US$208.69 million, a gap that suggests leveraged traders are still the dominant force driving HYPE's recent volatility.
Hyperliquid currently has a market cap of $20.05 billion and open interest value of $3.01 billion, which is a considerable leverage exposure that could accelerate price movement once the trend line determines its direction. The circulation supply is 251.81 million HYPE units, and the total supply and maximum supply are 951.82 million units, which means that most of the final supply has not yet entered circulation, which is an important factor to keep in mind for anyone building long-term HYPE forecasts.
Hyperliquid auction system analysis: Where new tokens come from
Beyond the chart itself, it has become clear how Hyperliquid controls the listing of new tokens on its network. 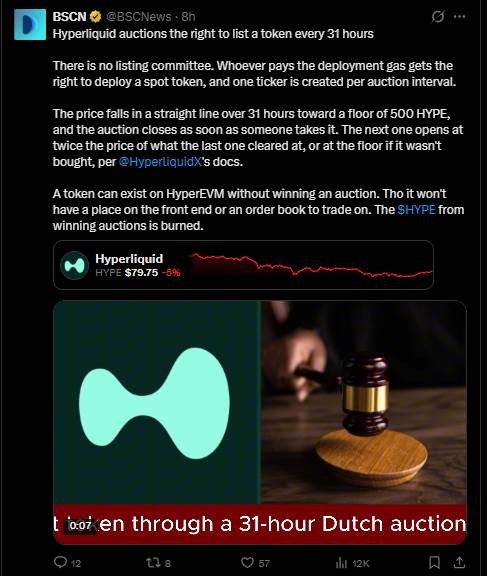 According to a post posted by the X platform BSCN, Hyperliquid has no listing committee. Instead, the right to list tokens is auctioned every 31 hours, and those who pay the deployment Gas fee will gain the right to deploy spot tokens and create code signs during that auction interval.
Its operating mechanism is quite specific. Prices plummet over a 31-hour window until they hit a reserve price of 500 HYPE, and the auction ended when someone accepted the price. The next auction will open at double the last transaction price, or return to the reserve price if no one buys during this window. Tokens can theoretically exist on HyperEVM without winning the auction, but without the auction results, it cannot actually be traded on the front end or order book. The HYPE spent on winning these auctions will be destroyed rather than recycled, which will inadvertently put downward pressure on overall supply over time.
For anyone who focuses on both Hyperliquid technical analysis and fundamentals, this auction destruction mechanism is a slow but real deflationary pressure, independent of anything shown in the chart itself.
Quick Overview: Overview of HYPE Price Behavior
- Current Price (CMP): US$79.79 (Bybit 1 hour chart)
- Pattern: The price attempts to break through from the downtrend line after being blocked many times.
- Hourly trigger conditions: A stable close above US$84.47 opens the path to US$89.62 and US$100.12
- Failure level: A closing below US$76.65 may cause a slip towards US$72.44
- Momentum reading: The chart oscillator reading is close to 42.25, which is in the neutral region. As breakthrough attempts develop, the market has not fully confirmed the strength and weakness
- Data Timestamp: September 11, 2026, 1 hour period. Bybit Perpetual Contract Chart
- Risk Warning: Leveraged positions are relatively high relative to spot positions, so confirmed breakthroughs in either direction may quickly trigger violent fluctuations
HYPE Technical Analysis: Breakthrough attempts underway
Observe the 1-hour chart of the HYPEUSDT perpetual contract on Bybit. HYPE has slipped on the downtrend line for several periods, and each backtest of this line produces a slightly lower high than the previous one. 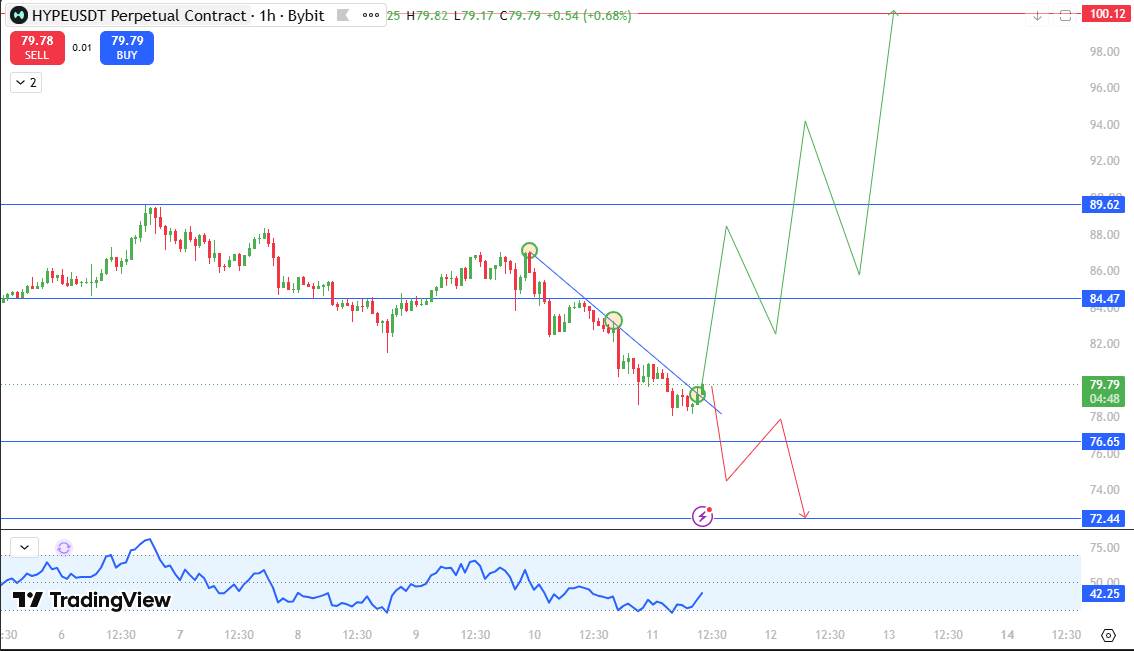 This pattern usually points to sellers constantly entering early, which is not a friendly background for breakthrough attempts. Even so, prices are now pushing closer to that trend line for the third time, and this attempt looks more determined than the previous two, with HYPE trading at $79.79 and the hourly line rising.
The oscillator reading on the chart is close to 42.25, which is in a fairly neutral region with neither clear confirmation of strength nor weakness, consistent with a market that is at a decision point rather than committed to a particular direction. Breakout attempts such as this, with flat momentum readings, will follow the performance of the closing price in the next few hours.
If HYPE can close above US$84.47, it will confirm that the trend line has finally given in, and the next resistance to focus on is US$89.62, after the region previously suppressed prices. A closing above that level would make $100.12 the next major target in this Hyperliquid price outlook, although a move of this magnitude is likely to be accompanied by a correction en route rather than a single straight line.
On the other hand, if a breakthrough attempt fails and HYPE closes below $76.65, this will confirm that sellers are still in control of the trend line and open the path to $72.44, a level that matches the next marked support level on the chart. Failure to break through accompanied by weak momentum will be a clear signal that this HYPE price outlook needs to turn bearish again.
Hyperliquid support and resistance levels to watch for
Hyperliquid (HYPE) key price vs. current price US$79.79
Price (USD) Type Price Distance from CMP $100.12 Main Resistance +25.5%$89.62 Resistance 2+12.3% $84.47 Resistance 1+5.9% $79.79 Current Price- $76.65 Support 1-3.9% $72.44 Main Support-9.2% HYPE bull market, Benchmark and Bear Market Scenarios
The bull market scenario here depends entirely on whether this third trend line attempt is successful, while the previous two failed. Closing above $84.47 will be the clearest sign that buyers are no longer letting sellers dominate the pace, and if that position is held,$89.62 will be the next real test. Clearing that resistance would open the door to $100.12, which happens to be at a psychological integer level, although getting there will almost certainly require one or two pullbacks rather than a straight rise.
The benchmark scenario, which is also in line with the view that the market is at a decision point, is that HYPE fluctuates in this trend line area for more time before committing. Since auction and destruction mechanisms operate silently in the background and are not reflected in short-term price fluctuations, it is not surprising that some hesitation appears on the hourly chart.
If this breakthrough attempt fails like the previous two and the price closes below $76.65, the bear market scenario will dominate. This will bring $72.44 back to the next downside target. Combined with the fact that futures trading volume is still much higher than spot demand, given the large amount of leverage exposure on the books, a rejection here may lead to a rapid unwinding.
The risk to this Hyperliquid price forecast
Leveraged positions remain high relative to spot activity, which means that a confirmed breakthrough in the trend line in any direction may be amplified by liquidation, faster than the spot chart alone suggests. Although structurally deflationary through destruction mechanisms, the auction-based token listing system is relatively new and still evolving, and its long-term impact on online supply behavior has not yet been fully priced by the market. Broader crypto market sentiment is also important here, as sharp movements in Bitcoin or shifts in overall risk appetite could pull HYPE away from this pattern, regardless of how its own trend line behaves.
Explanation of key terms
Trend line: A line connecting a series of price highs or lows shows the direction the market has been following, and once it finally breaks through, it usually turns into support or resistance.
Open Interest: The total number of derivative contracts (such as futures) that are still active in the market, often used as a measure of how much leveraged capital is involved.
Dutch Auction: A pricing mechanism in which the asking price starts at a high level and declines over time until a buyer accepts it. This is used to determine who wins the right to list new tokens on the Internet.
Disclaimer
This article is for reference only and should not be regarded as financial advice. The cryptocurrency market is extremely volatile, and price forecasts are based on technical analysis and may change rapidly as new markets develop. Be sure to conduct your own research before making any investment decisions.