Exchange Ranking
 Top Exchanges
 24h Volume Ranking
 Popularity Ranking
 Exchange BTC Balance
 Proof of Reserves
 Decentralized Exchanges
 Funding Rate
 Funding Heatmap
 Liquidation Data
 Max Pain
 Long/Short Ratio
 Whale L/S Ratio
 Binance/Okex/Huobi L/S
 Bitfinex Margin L/S
 ETF Tracker
 Solana ETF
 XRP ETF
 Hong Kong ETF
 Bitcoin Treasuries
 Crypto Reversal
 Ethereum Reserves
 HyperLiquid Wallet Analysis
 Hyperliquid Whale Watch
 Large Transactions
 On-chain Movement
 Bitcoin ROI
 Stablecoin Market Cap
 Options Analysis
 News
News Articles
 Economic Calendar
 Features
 Wallet
 Contract Calculator


 Security
 Collections
 Watchlist
 Following
 BTC
BTC PONS is currently rising rapidly, soaring 41.21% to approximately US$0.563 in the past 24 hours. This performance far exceeded the crypto market, which only rose 1.81% over the same period. Bitcoin rose 1.95%, and it is clear that PONS is comprehensively outperforming other assets.
The main driving force for this rise was the huge speculative trading volume behind it. PONS '24-hour trading volume exceeded US$114 million, an increase of 28.53%. For a small token traded on Hyperliquid, this is very active volume and explains why the price is rising so quickly.
Why is the price of PONS skyrocketing?
There are no specific fundamental catalysts in the available data that can explain the 41.21% increase. The data tends to indicate that traders are actively buying the token as momentum builds. The PONS price had previously rebounded from about $0.3010 to $0.5295, an increase of about 76%. The latest move currently towards $0.563 continues this rally and is accompanied by a surge in trading volume.
Bitcoin's 1.95% gain and the broader market's 1.81% gain have also created a positive environment for risky crypto assets. However, PONS's 41.21% increase is more than 20 times the increase in Bitcoin, indicating that most of the buying pressure comes from PONS's own trading activity.
This also brings obvious risks. When the rally is driven mainly by speculation and volume, the momentum can quickly fade once traders start taking profits. Therefore, the transaction volume data of $114.14 million deserves close attention. Staying above $100 million suggests trading activity remains strong, but a drop below $80 million could be an early warning sign that interest is cooling.
Let's take a look at the chart of PONS
The chart of PONS shows a strong rebound in the price from approximately US$0.3010 to US$0.5295, putting the token at the high level of the near-term range. 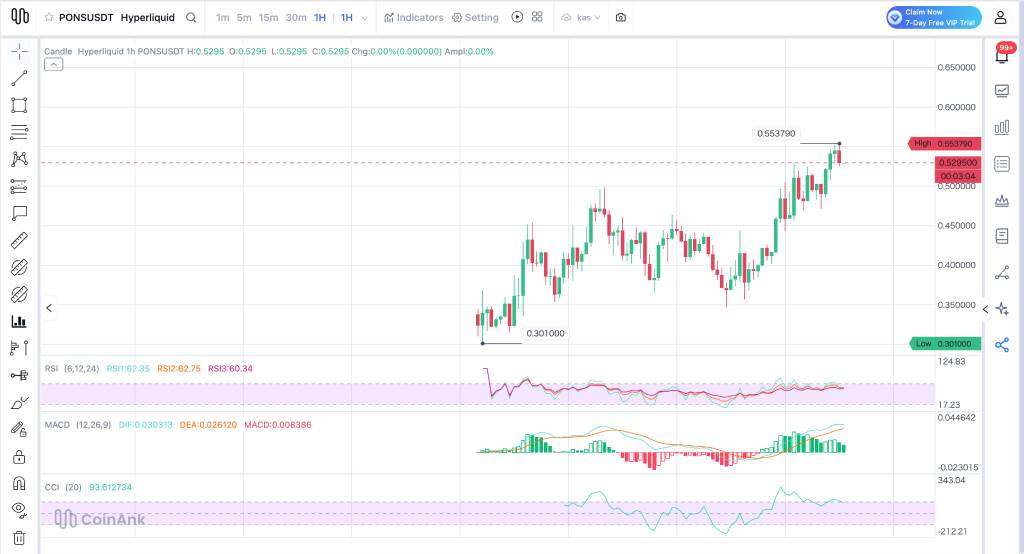
Kinetic indicators support a bullish pattern. Three RSI readings ranged from 60.34 to 62.75, indicating buyers are in control, although the readings are approaching the traditional 70 overbought level.
MACD still shows bullish momentum, with the DIF line remaining above the DEA line. This is a good signal. The CCI is 93.61 and is approaching the 100 overbought mark, so the market is heating up but not yet overheating.
The first important test is $0.55. After breaking through that position, the next target is $0.60, then $0.65. If buyers break through US$0.65 with volume, then US$0.75 will become the next target. Therefore, the path has been clear, and the only question is whether the momentum can continue to advance.
Can PONS stay above $0.50?
The US$0.50 level has become an important support area. As long as PONS prices remain above that level, the bullish rally remains in effect.
If it falls below $0.50, it risks falling towards $0.45 and $0.40. If selling continues,$0.35 and $0.30 will come into view, while $0.30 is close to the bottom of the previous chart at about $0.3010. Therefore, this is the key bottom line at present.
For now, the data points to a speculative rebound driven by volume. The next major test is US$0.55, and the combination of price movements and trading volume will determine whether PONS prices can continue to move towards US$0.60 and US$0.65.
Frequently Asked Questions
What drives the price of PONS up? 
The available data mainly point to speculative trading and high-volume activities. No specific fundamental catalysts were found in the data provided. PONS also benefited from a positive crypto market environment, but its 41.21% increase was much higher than Bitcoin's 1.95% increase.
Is PONS overbought?
PONS is approaching overbought territory, but the RSI reading has not yet reached 70. The CCI is 93.61, which is also close to the 100 threshold. This means the rally may continue, but the risk of consolidation or profit-taking is increasing.