Exchange Ranking
 Top Exchanges
 24h Volume Ranking
 Popularity Ranking
 Exchange BTC Balance
 Proof of Reserves
 Decentralized Exchanges
 Funding Rate
 Funding Heatmap
 Liquidation Data
 Max Pain
 Long/Short Ratio
 Whale L/S Ratio
 Binance/Okex/Huobi L/S
 Bitfinex Margin L/S
 ETF Tracker
 Solana ETF
 XRP ETF
 Hong Kong ETF
 Bitcoin Treasuries
 Crypto Reversal
 Ethereum Reserves
 HyperLiquid Wallet Analysis
 Hyperliquid Whale Watch
 Large Transactions
 On-chain Movement
 Bitcoin ROI
 Stablecoin Market Cap
 Options Analysis
 News
News Articles
 Economic Calendar
 Features
 Wallet
 Contract Calculator


 Security
 Collections
 Watchlist
 Following
 BTC
BTC Bitcoin and gold are highly convergent: The correlation on the 90th hit a new high since 2020
Bitcoin and gold fluctuate in the same direction frequently and rarely. According to Bitwise data, the 90-day correlation between the two has climbed to its highest level since 2020. This trend is partly due to investors withdrawing from long-term Treasury bonds, pushing the yield on the 10-year Treasury bond to about 4.8%.
Overview of key data
According to Bitwise analysis, the 90-day correlation between Bitcoin and gold reached an unprecedented peak for the first time since 2020. Grayscale's research also confirmed this trend, with data showing that the correlation has exceeded 50%, compared with almost zero at the beginning of the year.
Meanwhile, Glassnode data pointed out that during the August stock market rally, the 30-day correlation between Bitcoin and the S & P 500 dropped to near zero. In addition, in the past 90 days, Bitcoin's trend has been negatively correlated with the U.S. dollar. During this period, spot ETFs recorded average daily net inflows of up to US$290 million at market highs.
Convergence with gold and doubts about stock market decoupling
To better understand this market trend, our cross-market correlation analysis reviews the links between Bitcoin and major financial markets. With the recent wave of bond selling rising, long-term yields rising, and the Treasury Department, led by Scott Bessent, increased its purchases of long-term securities, the 90-day correlation between Bitcoin and gold has climbed.
For Bitwise, it is becoming increasingly difficult for investors to distinguish Bitcoin from gold. André Dragosch, head of European research at Bitwise, said Bitcoin may even start to behave like a "scaled-up" version of gold.
A report written by Zachary Pandl released by Grayscale Research on August 27 further confirms this trend: the correlation between Bitcoin and gold now exceeds 50%, compared with almost zero at the beginning of 2026; at the same time, the correlation between Bitcoin and the Nasdaq 100 Index has dropped from approximately 60% to 33%.
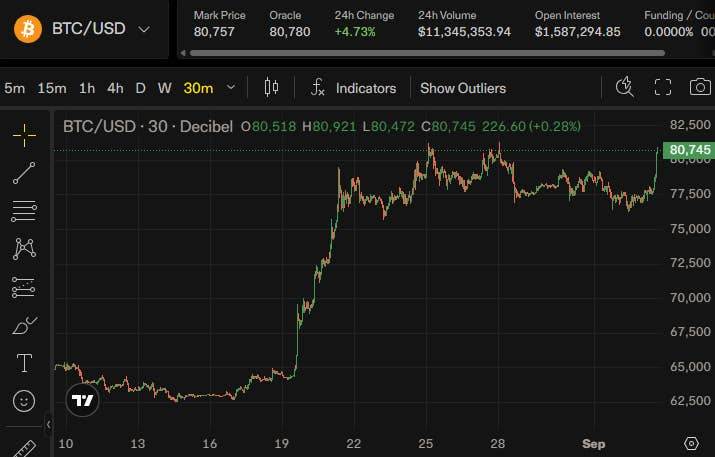
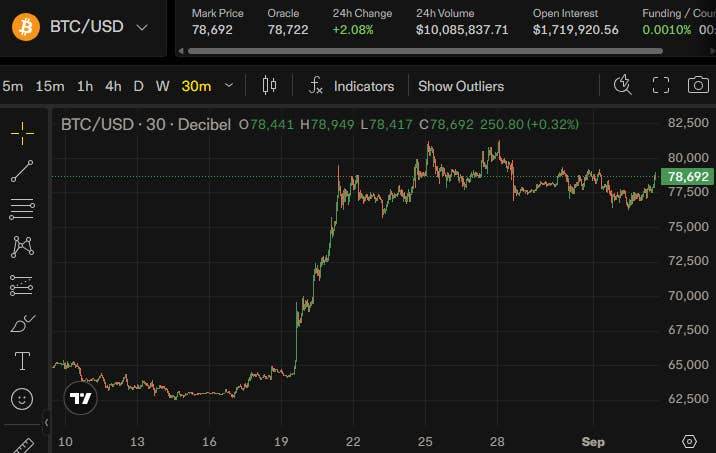
On-chain data sends some caution signals. In its report,"Weekly Weekly 2026 Week 35", Glassnode pointed out that during the August rebound, the 30-day correlation between Bitcoin and the S & P 500 fell to near zero. However, historical experience shows that such sudden decoupling during large-scale sovereign bond sales is often temporary and reflects more local exhaustion of momentum than structural shifts. The rebound after short squeeze was blocked in the $83,000 to $86,000 range, with support below between $62,000 and $65,000.
Bloomberg ETF analyst Eric Balchunas proposed a third interpretation: Over a six-month time dimension, Bitcoin has a weaker correlation with U.S. stocks than gold, small-cap stocks, emerging markets, or treasury bonds. The long-term correlation between Bitcoin and stocks remains stable, at around 0.40; what has really changed is gold and treasury bonds, which are gradually moving closer to stocks, while Bitcoin's own narrative logic has not changed.
Information revealed by on-chain data and Bitcoin ETF flows
Our on-chain analysis of the Bitcoin cycle shows that the US$83,000 to US$86,000 range constitutes technical resistance, while the US$62,000 to US$65,000 range is a bearish reference level until a clear breakthrough signal appears. The direction of spot ETFs-which hit $290 million a day at market highs-will become an important complementary indicator, helping to distinguish true underlying demand from a simple price rebound.
The next key signal to watch is: Will the 30-day correlation between Bitcoin and the S & P 500 continue to remain near zero, or will it return quickly? Between Bitwise's optimistic expectations and Glassnode's cautious attitude, the answer will gradually become clear in the coming bond trading session.