Exchange Ranking
 Top Exchanges
 24h Volume Ranking
 Popularity Ranking
 Exchange BTC Balance
 Proof of Reserves
 Decentralized Exchanges
 Funding Rate
 Funding Heatmap
 Liquidation Data
 Max Pain
 Long/Short Ratio
 Whale L/S Ratio
 Binance/Okex/Huobi L/S
 Bitfinex Margin L/S
 ETF Tracker
 Solana ETF
 XRP ETF
 Hong Kong ETF
 Bitcoin Treasuries
 Crypto Reversal
 Ethereum Reserves
 HyperLiquid Wallet Analysis
 Hyperliquid Whale Watch
 Large Transactions
 On-chain Movement
 Bitcoin ROI
 Stablecoin Market Cap
 Options Analysis
 News
News Articles
 Economic Calendar
 Features
 Wallet
 Contract Calculator


 Security
 Collections
 Watchlist
 Following
 BTC
BTC Bitcoin Price Analysis: Daily Chart Perspective
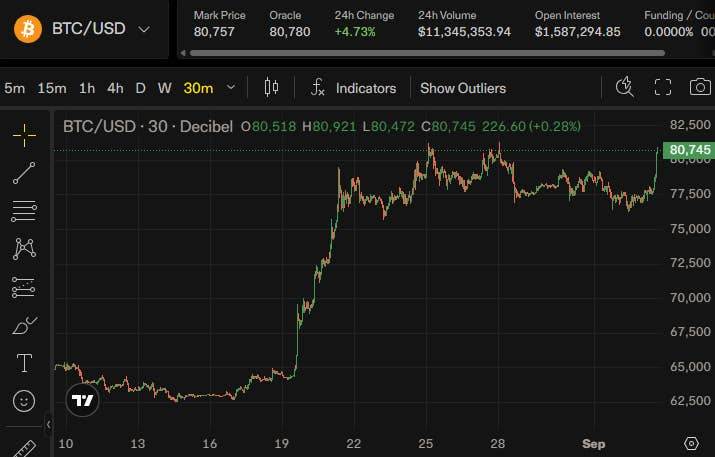
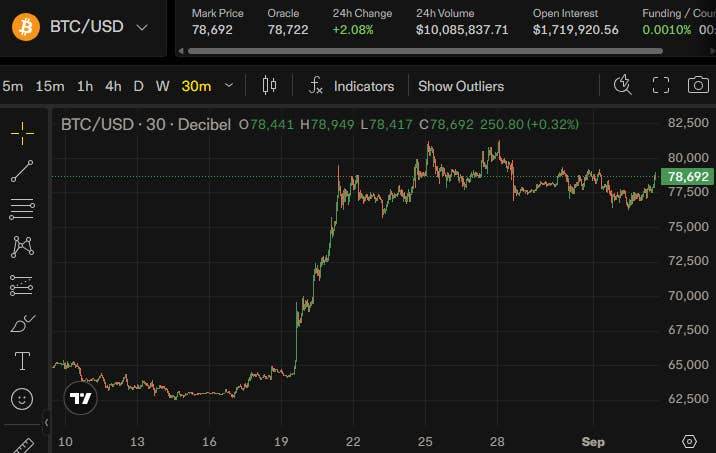
Daily Chart shows that the market structure has improved significantly after rebounding from the US$60,000 support area. Bitcoin broke through the $67,000 area and regained the $72,000 range that had previously been resistance. The price is currently trading around $78,500, firmly above the two main moving averages on the chart.
The short-term challenge lies in the US$82,000 resistance zone. This area coincides with recent band highs and is an important obstacle that buyers must overcome. A daily close above this level will consolidate the structure of the recovery, as it will form a higher low after months of downtrend. As a result, a potential breakthrough could pave the way to the $95,600 resistance level.
There is also a significant improvement in kinetic energy. The daily relative strength index (RSI) has climbed from the oversold area at the bottom of June and is now close to the edge of the overbought area. However, after reaching high levels, the RSI began to fall back, indicating that momentum is cooling rather than accelerating.
In terms of downside risks, the US$72,000 range is the support level of primary concern. Holding this position will keep the broader recovery pattern intact; a deeper correction will require a renewed focus on the $67,000 area.
In summary, the daily structure remains cautiously optimistic, but Bitcoin needs to clear US$82,000 of resistance to confirm that the recent rally is turning into a stronger bullish continuation rather than another resistance rejection.
BTC/USDT 4-hour plot analysis
The 4-hour chart presents a more cautious picture. Since hitting the $82,000 area in late August, Bitcoin has been operating in a declining wedge structure. The upper trend line has repeatedly suppressed the upward trend, while the lower trend is currently near US$76,000.
Bitcoin is currently testing the upper boundary of the structure again. Successful breakthrough of this resistance line, which is currently near $78,000 and trending downward, would be the first signal that buyers are trying to regain short-term control.
Once a breakthrough is made, prices may move again towards the US$82,000 area, which, as mentioned earlier, is the most important resistance level on the daily time frame.
Conversely, if the wedge structure cannot be broken through and fall below US$76,000, it may trigger a deep correction towards the US$72,000 to US$74,000 region. The area has been transformed into support after being previously breached upwards. Holding this range is crucial to maintaining the momentum of the recovery, as a failure could cancel out all the positive price movements Bitcoin has shown in the past few weeks.
On-chain data analysis
The exchange-whale ratio measures the proportion of exchange inflows associated with the largest transactions and helps assess whether large holders have become more active in transferring bitcoins to exchanges. An increase in that ratio may signal an increase in potential selling pressure, but it does not necessarily mean that the whales are selling immediately.
The chart shows that the 30-day moving average of the bitcoin exchange whale ratio rose sharply during the latest price increase. The ratio has rebounded to around 0.32, almost reaching the highest level visible in the chart, while Bitcoin is trading at approximately $78,500.
This development deserves close attention. Although Bitcoin has rebounded sharply from its June lows, the rising whale ratio suggests that large transactions flowing to exchanges have also become more prominent, which could lead to an imbalance between supply and demand in favor of sellers. If this high reading persists and Bitcoin struggles to break through the $80,000 to $82,000 region, it may strengthen expectations that prices will be rejected or consolidated.
On the other hand, if the whale ratio subsequently declines while breaking through US$82,000, it will provide a stronger and constructive confirmation that increased whale activity has not translated into large-scale bargaining and that there is enough new demand to absorb whale selling.