Exchange Ranking
 Top Exchanges
 24h Volume Ranking
 Popularity Ranking
 Exchange BTC Balance
 Proof of Reserves
 Decentralized Exchanges
 Funding Rate
 Funding Heatmap
 Liquidation Data
 Max Pain
 Long/Short Ratio
 Whale L/S Ratio
 Binance/Okex/Huobi L/S
 Bitfinex Margin L/S
 ETF Tracker
 Solana ETF
 XRP ETF
 Hong Kong ETF
 Bitcoin Treasuries
 Crypto Reversal
 Ethereum Reserves
 HyperLiquid Wallet Analysis
 Hyperliquid Whale Watch
 Large Transactions
 On-chain Movement
 Bitcoin ROI
 Stablecoin Market Cap
 Options Analysis
 News
News Articles
 Economic Calendar
 Features
 Wallet
 Contract Calculator


 Security
 Collections
 Watchlist
 Following
 BTC
BTC Summary
Bitcoin prices are supported by recovery in ETF demand, and the holder's loss-to-expenditure surplus ratio (SOPR) will define the next market test point.
Catalog
Bitcoin prices rose 1.41% to US$79,509.65 in 24 hours, following the overall 1.43% increase in the crypto market. The continued inflow of institutional funds provides strong support for demand. According to Glassnode data,$643 million entered spot funds last Thursday; products tracked by Farside recorded a net inflow of $730.8 million.
In August 2026, spot bitcoin exchange-traded funds (ETFs) attracted total inflows of $3.52 billion, the strongest monthly record for the year, and recorded net inflows on 16 of the 21 trading days. Currently, BTC's key support range is between $77,200 and $78,000, while $82,000 is the main resistance level. The upcoming September 11 US inflation data will be the next big test for the market.
Bitcoin price gains support from ETF demand
Bitcoin has risen 1.41% in the past 24 hours to $79,509.65, driven by a new round of funding demand. This price trend is highly consistent with the 1.43% increase in the broader crypto market, indicating that the rally has exceeded the category of single assets. Institutional capital flows have become the clearest catalyst. Glassnode reported that $643 million poured into the spot Bitcoin ETF on Thursday, the largest net inflow reading in a single day since January this year.
The latest market rally follows dramatic changes in fund activity. Among U.S. spot products, 16 of the 21 trading days in August attracted capital inflows. In addition, from August 17 to August 27, positive inflows were recorded for nine consecutive trading days.
Total assets held by these funds climbed to $99.61 billion at the end of August, up from $76.29 billion in July. Monthly trading volume also increased nearly 49% to US$58.63 billion. These data suggest that capital size and trading activity have expanded during the rebound.

However, the flow of funds in September did not show a single direction. The Bitcoin ETF lost $236.5 million on September 1, before adding $101.1 million and $730.8 million respectively in the next two trading days. There was another $174.6 million inflow on September 4, but there was an outflow of $46.6 million on September 8.
This uneven funding sequence has caused the market to pay more attention to whether institutional subscriptions continue after large Thursday allocations. Continued net inflows can absorb chips sold by sellers, while increased redemptions can weaken the source of spot demand.
Broader market factors also affect Bitcoin prices. Its seven-day correlation with the S & P 500 reached 87.1%, indicating that both markets are responding to similar macro forces. At the same time, the Crypto Fear and Greed Index is at a level of 74, still in the "greedy" range.
This correlation is particularly important during a data-intensive week. Higher inflation readings could push yields higher and put pressure on risky assets, while milder data could support liquidity-sensitive markets. However, this correlation can change rapidly between trading sessions.
U.S. consumer inflation data due to be released on September 11 constitutes the next scheduled macro test node. After the release, traders may reassess interest rate expectations, which in turn affects stock, bond yields, the U.S. dollar and crypto assets.
Holder losses and SOPR definition next market test
On-chain data provides a different perspective on the recovery of Bitcoin prices. DanCoinInvestor, a contributor to CryptoQuant, pointed out that some medium-and long-term holders are still reporting losses. This behavior is particularly evident when the expenditure surplus ratio (SOPR) is below 1.
SOPR compares the value of the coin when it was spent to its value when it was created. A reading above 1 on average means a profit has been achieved, while a value below 1 indicates that the coins being moved are, on average, spent at a loss.
Periods below this threshold usually occur during capitulation or bear market conditions. They may also appear near local lows, when holders in floating losses sell while stronger buyers accumulate available supply. However, this indicator does not guarantee reversal, nor does it identify the specific amount sold by each holder group.
CryptoQuant's analysis pointed out that public attention also weakened during the previous loss redemption stage. Historically, a combination of low interest and long-term holders selling below cost prices has often occurred during rare accumulation windows. <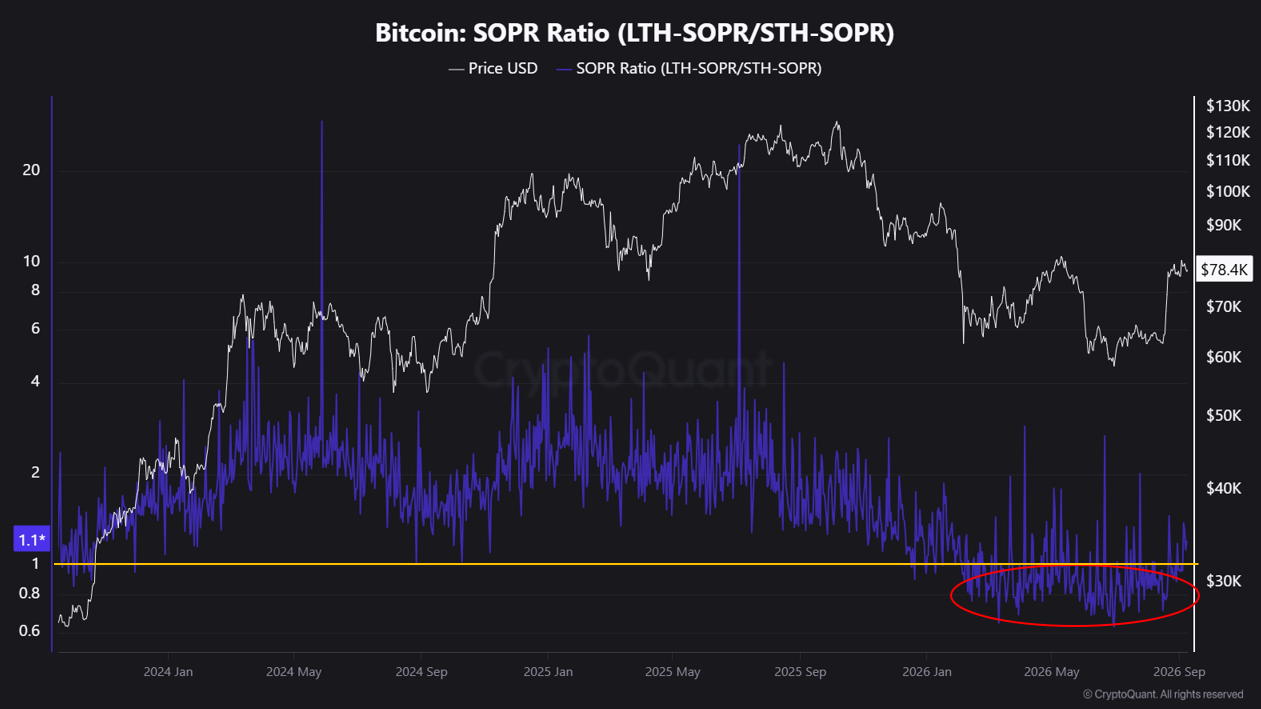 >
>
In terms of the current Bitcoin price pattern, US$77,200 to US$78,000 forms an immediate support area. Holding that area would leave open the possibility of retesting the $82,000 resistance level. If it can effectively break through US$82,000, it will mark a further attempt to extend the August rally.
Conversely, if support breaks below, the next downside target will be exposed to US$74,700. Therefore, bitcoin prices must balance multiple factors such as cash ETF inflows, holder cashing in losses, and Friday's release of inflation data. Each variable may affect whether buyers can defend the current range or whether sellers can regain control.