Exchange Ranking
 Top Exchanges
 24h Volume Ranking
 Popularity Ranking
 Exchange BTC Balance
 Proof of Reserves
 Decentralized Exchanges
 Funding Rate
 Funding Heatmap
 Liquidation Data
 Max Pain
 Long/Short Ratio
 Whale L/S Ratio
 Binance/Okex/Huobi L/S
 Bitfinex Margin L/S
 ETF Tracker
 Solana ETF
 XRP ETF
 Hong Kong ETF
 Bitcoin Treasuries
 Crypto Reversal
 Ethereum Reserves
 HyperLiquid Wallet Analysis
 Hyperliquid Whale Watch
 Large Transactions
 On-chain Movement
 Bitcoin ROI
 Stablecoin Market Cap
 Options Analysis
 News
News Articles
 Economic Calendar
 Features
 Wallet
 Contract Calculator


 Security
 Collections
 Watchlist
 Following
 XRP
XRP Whale selling and decline in chain activity: Analysis of key support levels for XRP
During the recent market correction, whale accounts sold or reallocated approximately 90 million XRPs, while the number of daily active addresses dropped sharply. Currently, the XRP price remains around US$1.35, with the range of US$1.30 to US$1.39 constituting key support. Breaking through and stabilizing US$1.38 to US$1.39 is a necessary condition to strengthen the rebound trend.
XRP has fallen 20% in the past three weeks, from $1.70 to $1.35, as whale sales and weakening online activity have put pressure on token prices. Analysts Ali Charts and Crypto Patel pointed to key prices for the next move for XRP. At the same time, technical data showed significant support between $1.30 and $1.39.
Whale selling and weakening Internet activity
According to Ali Charts, approximately 90 million XRPs were sold or reallocated in whale accounts in the past week. He attributed some of the recent decline to profit-taking after XRP's previous gains. In addition, during the pullback period, Internet activity also fell sharply.
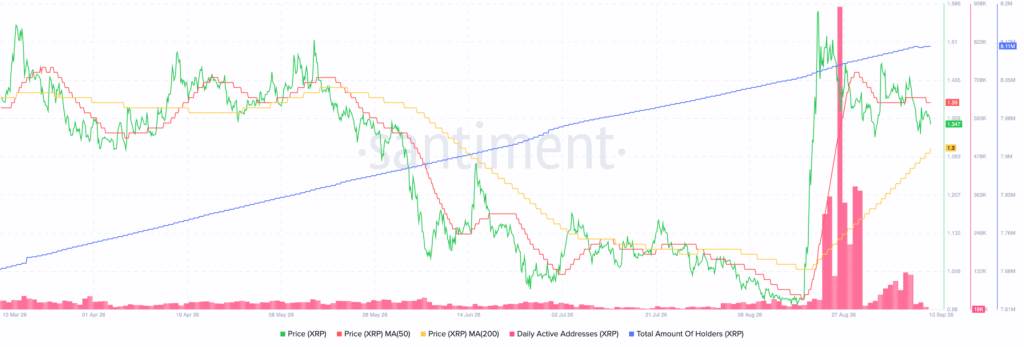
The number of daily active addresses dropped by 90.18%, from 388,492 to 38,163. However, another chart shows that during XRP's rebound in late August, activity reached about 938,000. The current readings on the chart are close to 18,000.
Ali Charts identified $1.35 as a key support level and noted that 2.29 billion XRPs had previously been traded near this level. He said that if it could rebound above $1.38, it would open the way for prices to move towards $1.60 and $1.68.
Crypto Patel highlights resistance at $1.55
Crypto Patel focuses on the broader price structure of XRP and resistance around $1.55. He pointed out that years of downward trend have been broken, but XRP is still below this important level. If the weekly closing price can stand above $1.55, the upper targets will point to $2 and $3.66.
Patel identifies US$3.66 as the all-time high (ATH) for XRP and a major level of breakthroughs. If the price breaks through that level, Patel predicts it may move further towards $10. However, he also identified US$0.70 to US$0.95 as the main demand area. If the $1.55 cannot be recovered, XRP may fall into this range again.
The technical level of XRP determines the next trend
XRP is currently trading at approximately US$1.347, after falling back from a high of approximately US$1.58 in late August. The token had previously fallen from the US$1.39 - 1.45 range in March to US$1.00 in early April, then rebounded to US$1.45 - 1.50, but fell back again to US$1.00 - 1.05 in early August.
The 50-day moving average is around $1.39, while the 200-day moving average is around $1.30. Therefore, the $1.30 to $1.39 region remains a key technical range.
Source:Santiment
If it can exceed $1.39,$1.45 and $1.50 will become the focus of attention. Recovering $1.58 will strengthen the rebound structure. However, a break below $1.30 may expose a support gap of $1.20 and $1.13 below. During this period, the number of XRP holders has increased to approximately 8.11 million.