Exchange Ranking
 Top Exchanges
 24h Volume Ranking
 Popularity Ranking
 Exchange BTC Balance
 Proof of Reserves
 Decentralized Exchanges
 Funding Rate
 Funding Heatmap
 Liquidation Data
 Max Pain
 Long/Short Ratio
 Whale L/S Ratio
 Binance/Okex/Huobi L/S
 Bitfinex Margin L/S
 ETF Tracker
 Solana ETF
 XRP ETF
 Hong Kong ETF
 Bitcoin Treasuries
 Crypto Reversal
 Ethereum Reserves
 HyperLiquid Wallet Analysis
 Hyperliquid Whale Watch
 Large Transactions
 On-chain Movement
 Bitcoin ROI
 Stablecoin Market Cap
 Options Analysis
 News
News Articles
 Economic Calendar
 Features
 Wallet
 Contract Calculator


 Security
 Collections
 Watchlist
 Following
Pi Network Price Forecast: Can the Resistance Wall be Breakthrough?
Pi Network has built higher lows along a stable uptrend line over the past few weeks, while daily charts show prices are being directly under a resistance wall that has previously served to curb price increases. This Pi Network price forecast will analyze whether buyers will ultimately force a price breakthrough, or whether the support forces that have maintained the trend line since July will give way.
Pi Network launched its main network after years of mobile mining through its apps, positioning it as a convenient entry into the cryptocurrency space for millions of users who had participated in mining before their tokens were traded on the exchange. Since then, prices have experienced sharp fluctuations, and the current situation marks one of the most closely watched technical tests in recent times.
Today's Pi Network price is $0.08241, down 0.9% in the past 24 hours. The price range for the past 24 hours has remained between $0.08087 and $0.08415. This Pi Network price forecast reflects current data as of September 18, 2026 and is of reference value for anyone who follows today's Pi Network prices.
Real-time market data
Indicator values Price $0.08241 24-hour change-0.9% 24-hour interval $0.08087 - $0.08415 Market value $925,646 million Fully diluted valuation $1.424 billion 24 billion 24-hour transaction volume $86.83 million circulation supply 11.233 billion Total supply 17.281 billion Maximum supply 100 billion Data source: $PI market data is taken from CoinGecko, as of September 18, 2026. Data from different tracking sites may differ slightly.
Today's Pi Network News
Recent Pi coin news focuses on protocol development rather than just price. An update to the Pi Network community channel states that Testnet 1 is now running on Protocol v28, and Testnet 2 may soon follow up on Protocol v27.
 Such technological advances tend to attract renewed attention from traders who closely follow today's Pi Network news, although current price movements remain focused on testing trend lines.
Technical Analysis: Pi Network Coin Outlook
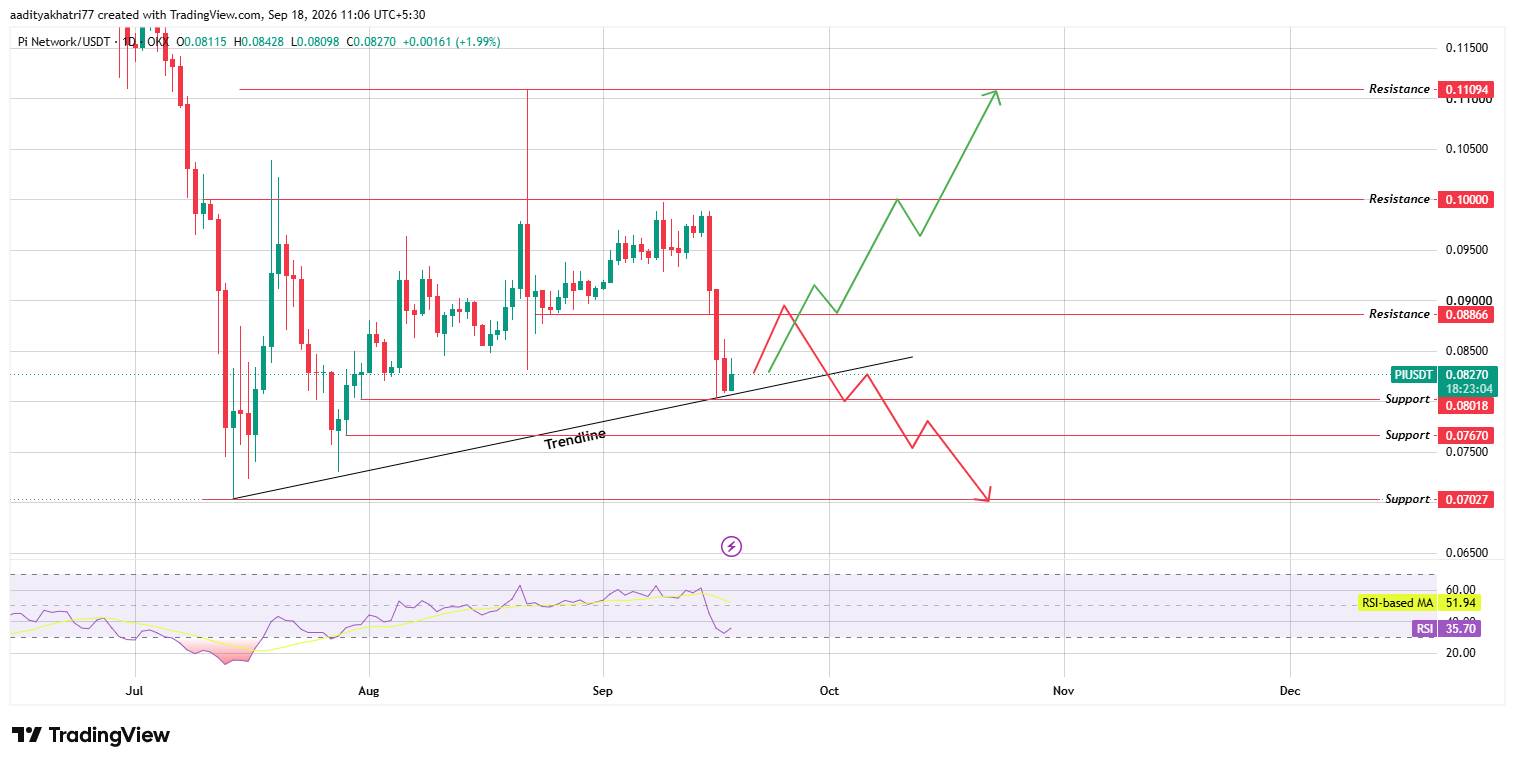
Daily charts show that $PI has remained above a uptrend line since early July, and buyers have found support every time they pull back to this line. Currently, prices are testing the resistance zone above the trend line, which has rejected price attempts twice this month.
The RSI (Relative Strength Index) is at 35.70, below its moving average of 51.94, indicating that kinetic energy has cooled although the overall structure remains intact.
Can PI break through resistance walls?
如果成交量放大,且价格从趋势线干净利落地反弹并清除 $0.08866 的阻力水平,下一个目标位将设在 $0.10000。持续突破该水平可能会打开通往 $0.11094 的路径,这是交易者关于2026年9月 Pi Network 价格预测讨论中提到的区域。这种情况需要价格在阻力位上方实现确认性的日线收盘,而非短暂的盘中尖峰。
如果 PI 在此处遭到拒绝会发生什么?
在当前阻力位遭到拒绝,加上跌破上升趋势线,将使局势转向看跌。在这种情况下,$0.08018 的支持位首先发挥作用。更深的跌破可能会将价格推向 $0.07670,如果卖压加剧且趋势线未能守住,更大幅度的下跌可能会测试 $0.07027。
支撑与阻力水平
支撑位阻力位 $0.08018$0.08866 $0.07670$0.10000 $0.07027$0.11094 牛市、基准和熊市情景
情景设置水平 牛市趋势线反弹,伴随成交量的阻力突破$0.08866 → $0.11094 基准在趋势线和阻力位附近的持续区间震荡$0.080 - $0.088 熊市趋势线跌破,拒绝得到确认$0.08018 → $0.07027 Pi Network 与比特币
Pi Network 的价格走势显示出与市场整体情绪的某种相关性,但由于该币交易历史相对较短且正在进行持续的协议开发,这意味着在网络特定新闻驱动的时期,它可能与比特币出现背离。更广泛的加密货币市场中更强的风险偏好可能会支持 $PI 清除阻力的尝试,而更广泛的市场回调则可能给目前支撑价格的趋势线增加压力。
方法论
本 Pi Network 价格预测基于使用趋势线映射、支撑和阻力识别以及 RSI 动量读数的日线图表分析。价格水平直接源自当前的图表结构,而非推测性外推,所有数据均已与截至2026年9月18日的实时市场数据进行交叉核对。
专家观点
关注 $PI 日线结构的分析师指出,在反复的阻力测试中保持上升的趋势线通常表明买方兴趣正在积累,尽管确认通常需要一次有成交量支持的突破,而不是单一的红蜡烛形态。由于价格在趋势线和阻力位之间盘整,接下来的几个交易日可能会决定 $PI 向哪个方向解析。
免责声明: This Pi Network price forecast is based on technical chart analysis and current market data and should not be considered financial advice. The cryptocurrency market is extremely volatile, and the price targets discussed here are subject to significant uncertainties. Breakthroughs and breakdowns are possible, and readers should study and consider their own risk tolerance before making any investment decisions.