Exchange Ranking
 Top Exchanges
 24h Volume Ranking
 Popularity Ranking
 Exchange BTC Balance
 Proof of Reserves
 Decentralized Exchanges
 Funding Rate
 Funding Heatmap
 Liquidation Data
 Max Pain
 Long/Short Ratio
 Whale L/S Ratio
 Binance/Okex/Huobi L/S
 Bitfinex Margin L/S
 ETF Tracker
 Solana ETF
 XRP ETF
 Hong Kong ETF
 Bitcoin Treasuries
 Crypto Reversal
 Ethereum Reserves
 HyperLiquid Wallet Analysis
 Hyperliquid Whale Watch
 Large Transactions
 On-chain Movement
 Bitcoin ROI
 Stablecoin Market Cap
 Options Analysis
 News
 Articles
 Economic Calendar
 Features
 Wallet
 Contract Calculator


 Security
 Collections
 Watchlist
 Following
 BTC
“红色九月”魔咒或终成历史,比特币创纪录表现背后是市场情绪的反转
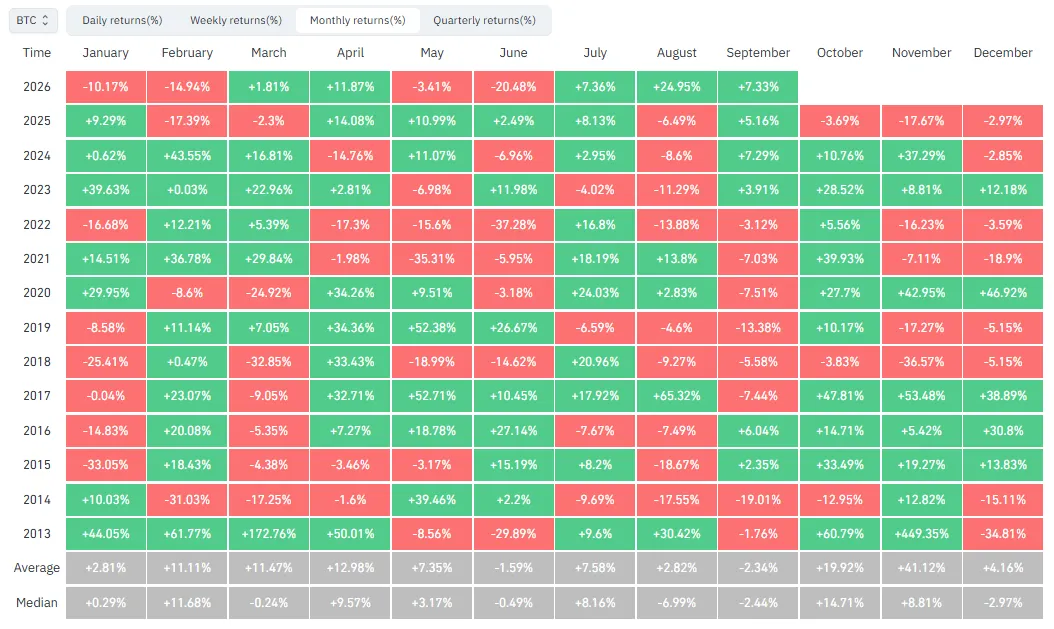
“红色九月”的魔咒或许终于要终结了。本月比特币已上涨 7.33%,若今日至明日之间未出现异常波动,这将是 CoinGlass 价格追踪器历史上表现最好的九月。
这一纪录的诞生仅差毫厘。2024 年 9 月的回报率为 7.29%,因此随着最后一天临近,新纪录几乎与旧纪录持平。从 2013 年至 2025 年的 13 年间,比特币在 8 个年份的 9 月以下跌收盘,其中包括 2017 年至 2022 年的连续六年下跌。即便在今年实现增长后,根据 CoinGlass 的数据,9 月的平均回报率仍为负 2.34%,是所有月份中最差的。
然而,趋势正在发生转变。比特币在 2023 年 9 月收于上涨 3.91%,2024 年为 7.29%,2025 年为 5.16%。若今年继续保持涨势,这将实现连续四年上涨,创下该月份有数据记录以来的最长连涨纪录。
如果在此时还能称之为“诅咒”,那么“红色九月”并非加密货币所独有。自 1945 年以来,标普 500 指数在 9 月的平均收益也为负值,假期因素及税务亏损收割策略等不同原因解释了这一现象。
Bitcoin opened at about $78,500 at the beginning of the month after soaring 25% in August. The situation changed in the middle of the month. On September 15, the Senate's "Clarity Act" failed to pass a cloture vote, with a vote of 49 to 50. On the same day, a net outflow of $450.4 million in spot Bitcoin ETF, setting the worst one-day performance since June.
The next day, the Federal Reserve raised interest rates by 25 basis points to 3.75%-4%, the first rate hike since 2023. Risky assets, including cryptocurrencies and stocks, are sensitive to changes in interest rates because the cost of "cheap money" for risky bets fluctuates, and Bitcoin fell to about $75,000 after raising interest rates.
As a result, Bitcoin hit the brakes and even showed a slight correction. It looked like September would end down again. But then the market reversed. ETFs had net inflows of approximately US$2.98 billion for seven consecutive trading days, including nearly US$1 billion in a single day on September 21, the best performance since the month. Shorts were squeezed, clearing more than $800 million in 24 hours, and Bitcoin soared to $87,354, the highest level since late January.
Since then, Bitcoin has given up some of its gains, about 4%. Brent crude oil prices rebounded above $100 and Bitcoin slipped to $83,000 on Monday after President Donald Trump rejected Iran's conditions to reopen the Strait of Hormuz.
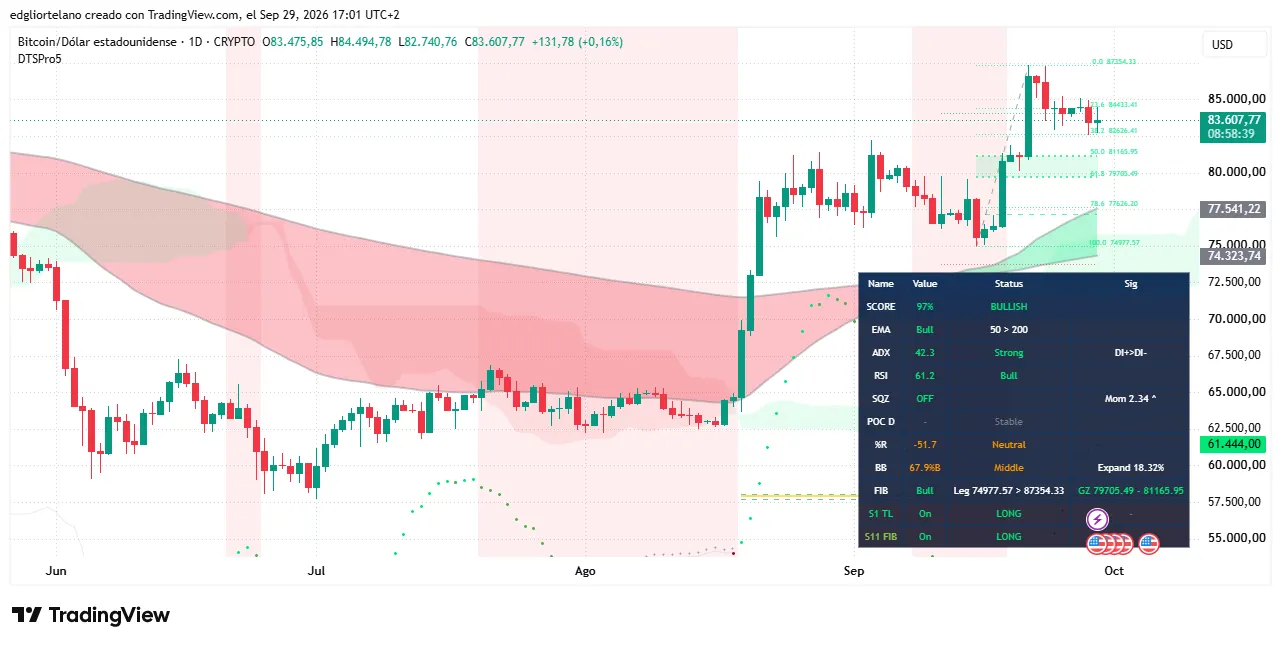
On the daily chart, this correction is shallow. The Fibonacci retracement level marks the retracement ratio of previous movements, positioning the natural support and resistance area between $74,978 and $87,354.
Trend indicators remain bullish. The average Directionality Index (ADX), which measures the strength of trends (0-100 scales, which does not indicate direction), read 42.3, well above the 25 threshold used by traders to identify strong trends. The Relative Strength Index (RSI, a momentum indicator from 0 to 100 points, above 70 indicates overbought) is currently at 61.2. The 50-day moving average is also above the 200-day moving average, a classic bullish pattern known as the "golden cross."
If it breaks below US$82,626, the next support range is US$81,166 to US$79,705, which corresponds to 50% and 61.8% retracement levels respectively.
September's rise will not completely solve all investors 'problems in 2026. Bitcoin is still below the approximately US$87,497 it was traded at the beginning of the year, a decline of approximately 4.4%. After rising in September last year, it fell 3.69% in October and plunged 23% in the fourth quarter. This year, the next meeting of the Federal Reserve is scheduled for October 27-28 and December 8-9.
To maintain the September record, Bitcoin needs to close above approximately US$83,600 by the end of the month. The average return in October in the same table was 19.92%, but don't expect to repeat this performance this year.