Exchange Ranking
 Top Exchanges
 24h Volume Ranking
 Popularity Ranking
 Exchange BTC Balance
 Proof of Reserves
 Decentralized Exchanges
 Funding Rate
 Funding Heatmap
 Liquidation Data
 Max Pain
 Long/Short Ratio
 Whale L/S Ratio
 Binance/Okex/Huobi L/S
 Bitfinex Margin L/S
 ETF Tracker
 Solana ETF
 XRP ETF
 Hong Kong ETF
 Bitcoin Treasuries
 Crypto Reversal
 Ethereum Reserves
 HyperLiquid Wallet Analysis
 Hyperliquid Whale Watch
 Large Transactions
 On-chain Movement
 Bitcoin ROI
 Stablecoin Market Cap
 Options Analysis
 News
 Articles
 Economic Calendar
 Features
 Wallet
 Contract Calculator


 Security
 Collections
 Watchlist
 Following
 BTC
 ETH
比特币与以太坊:本周走势展望
随着市场消化了另一段波动剧烈的行情,比特币和以太坊在本周初分别围绕 83,000 美元和 2,500 美元进行交易。我们此前的周度预测将 82,000 至 86,000 美元界定为比特币的“中性区间”,目前 BTC 确实一直维持在该区间内。对于以太坊,我们曾指出若跌破 2,600 美元,将暴露出 2,500 美元的支撑位,随后是 2,400 至 2,390 美元的区间。这一看跌情景已然上演,ETH 曾短暂跌至约 2,405 美元,随后回升至 2,500 美元附近。本周的关键问题在于,这些反弹能否演变为更强劲的上行动能。
比特币价格分析
比特币的两小时图表显示,BTC 从 10 月初约 87,250 美元的高点下跌至 10 月 8 日附近的局部低点 80,345 美元。买盘在该水平做出强烈反应,推动 BTC 重新站稳 82,000 美元上方,并最终回升至目前的 83,000 美元区域。这种复苏态势具有建设性,但价格尚未突破更广泛的短期结构。在之前的抛售之前,BTC 曾在多个交易时段高于 84,000 美元交易,因此 84,000 至 85,000 美元成为第一个重要的阻力区域。
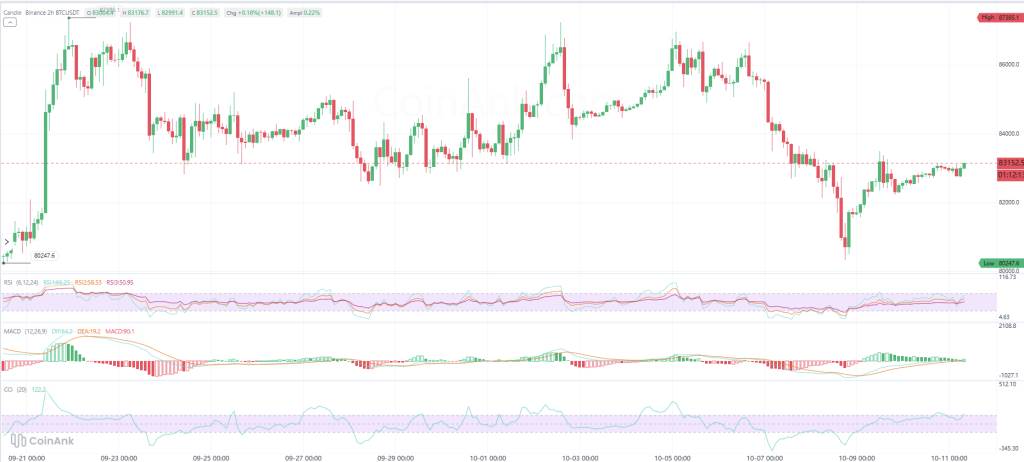
On top of that,$86,000 will become an even bigger test. If it can exceed US$86,000, the recent high of US$87,250 will come back into view. Support starts around $82,000. If this position is lost,$80,000 to $80,500 will once again become the key downside risk area.
Bitcoin indicators are improving
Bitcoin's momentum indicators have recovered significantly since the October 8 low. The short-term RSI is around 60.4, the midterm reading is close to 55.8, and the long-term RSI is close to 49.7. This means that short-term momentum has turned positive, but the larger momentum picture remains close to neutral. MACD has also improved, with the fast line above the signal line and the histogram positive, confirming that there is still momentum support behind the rebound. However, the magnitude of the positive histogram is shrinking, indicating that the pace of recovery is slowing. The CCI is close to 92, close to the +100 level that signals strong positive momentum.
Overall, Bitcoin's indicators are slightly positive for bulls in the short term, but BTC needs to break through US$84,000 to prove that this is more than just a temporary easing rebound.
Ethereum Price Analysis
Ethereum has experienced a more disruptive week. ETH started trading at around $2,700, but then selling pressure accelerated and the price fell below $2,600 and $2,500. The decline eventually hit about $2,405.
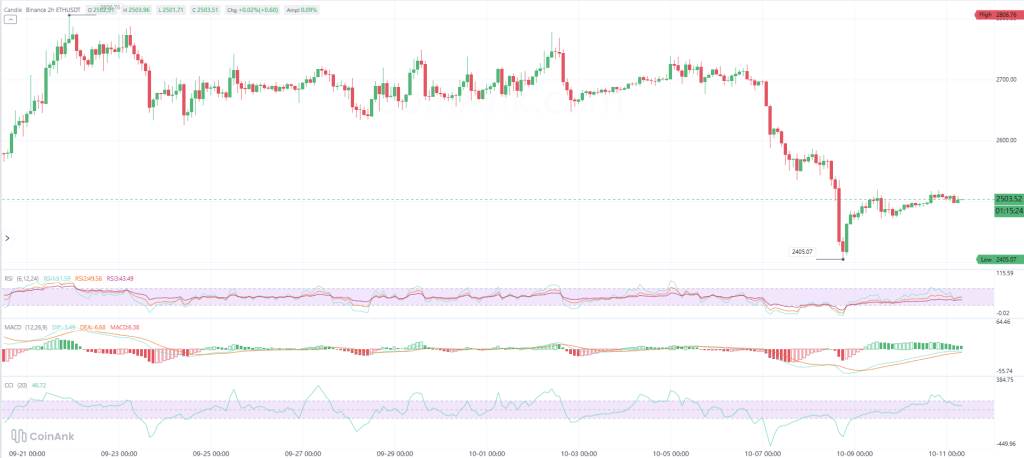
Buying actively defended the area, contributing to a rally towards $2,500. Since then, ETH has been entering a tight consolidation near this level. The current first support appears to be between $2,470 and $2,480. Below this position,$2,400 to $2,420 becomes the main defense area. On the upside side,$2,550 to $2,600 is the first meaningful area of resistance. Ethereum spent a lot of time above this area before the latest crash, so regaining the area would greatly improve the technical structure. Beyond $2,600, the next target area is around $2,650 to $2,700.
Ethereum momentum slowly recovers
Ethereum's RSI reading is not as impressive as Bitcoin. The short-term RSI is around 51.6, the midterm reading is around 49.6, and the long-term RSI is close to 43.5. This puts ETH close to neutral in the short term, while long-term readings remain weak. MACD is improving, the Express Line has crossed the signal line and the bar chart remains positive after rebounding from $2,405. But as with Bitcoin, the green bar chart is shrinking, suggesting that bullish momentum is losing some of its strength as ETH approaches $2,500. The CCI is around 47, which is positive but not particularly strong. As a result, as we enter the new week, Ethereum looks more fragile than Bitcoin.
This week's Bitcoin and Ethereum price forecast
Although both assets have recovered from recent lows, neither has fully repaired the technical damage caused by last week's sell-off.
For Bitcoin, the weekly structure is relatively simple. Holding above $82,000 could allow the rally to continue. Breaking through $85,000 will provide buyers with a real opportunity to re-test $86,000 to $87,250. If $82,000 falls, the possibility of testing $80,000 again will increase.
The task facing Ethereum is even more arduous. ETH needs to recover between $2,550 and $2,600 before the current market is seen as a stronger recovery. Until then, another visit for $2,450 or even $2,400 is still possible.