Exchange Ranking
 Top Exchanges
 24h Volume Ranking
 Popularity Ranking
 Exchange BTC Balance
 Proof of Reserves
 Decentralized Exchanges
 Funding Rate
 Funding Heatmap
 Liquidation Data
 Max Pain
 Long/Short Ratio
 Whale L/S Ratio
 Binance/Okex/Huobi L/S
 Bitfinex Margin L/S
 ETF Tracker
 Solana ETF
 XRP ETF
 Hong Kong ETF
 Bitcoin Treasuries
 Crypto Reversal
 Ethereum Reserves
 HyperLiquid Wallet Analysis
 Hyperliquid Whale Watch
 Large Transactions
 On-chain Movement
 Bitcoin ROI
 Stablecoin Market Cap
 Options Analysis
 News
News Articles
 Economic Calendar
 Features
 Wallet
 Contract Calculator


 Security
 Collections
 Watchlist
 Following
 XRP
XRP XRP prices have fallen back from their August highs, but analysts believe their current chart shape is similar to that before the historical rebound.
XRP prices have fallen back from their August highs, but Celal Kucuker believes that their current chart shape has similarities with the layout before a major historical rebound. This comparison opens up an ambitious outlook for recovery scenarios, although the argument needs to be strengthened before XRP still has important resistance to be breached. Dom's analysis pulls the discussion back to the current real-time price range. His chart identifies a familiar "ceiling" that has repeatedly prevented XRP's recovery attempts. Combining these two views raises a thought-provoking question: Will the current consolidation become the cornerstone of a larger level of market?
XRP price recovery follows a difficult first half of 2026
provides price history that shows XRP is currently in the US$1.35 to US$1.39 range, compared with around US$1.88 at the beginning of 2026. This means that even though XRP has rebounded from summer lows, its price has fallen by about 26% to 28%.
This decline went through several stages. XRP fell early in the year, and then hovered between $1.35 and $1.45 between February and March. This narrow trading range provided temporary stability but did not produce a lasting recovery. The trend weakened further in the spring and summer, with XRP trading between about $1.00 and $1.33 in June and July, with history indicating a brief drop to lows close to $0.80.
Buyers responded more strongly in August. XRP rose about 28.5% during the month, reaching a recent peak of nearly $1.70. There was a correction in September, entering the range of $1.31 to $1.48. This sequence is important because the August rally interrupted an early downtrend. However, XRP prices are still below their annual starting point and recent highs. The recovery still needs further verification before it is confirmed that this is a lasting reversal.
Celal Kucuker compares XRP prices with previous major rallies
Celal Kucuker's analysis focuses on the relationship between XRP prices, moving averages, and downtrend resistance. His core argument is that XRP has returned to a technical position similar to its previous sharp gains.
Looking at the XRP chart, you can see two downwardly sloping blue resistance lines throughout different market periods. The earlier line covers the decline and consolidation period before the breakthrough at the end of 2024. The newer line extends to the recent downtrend. 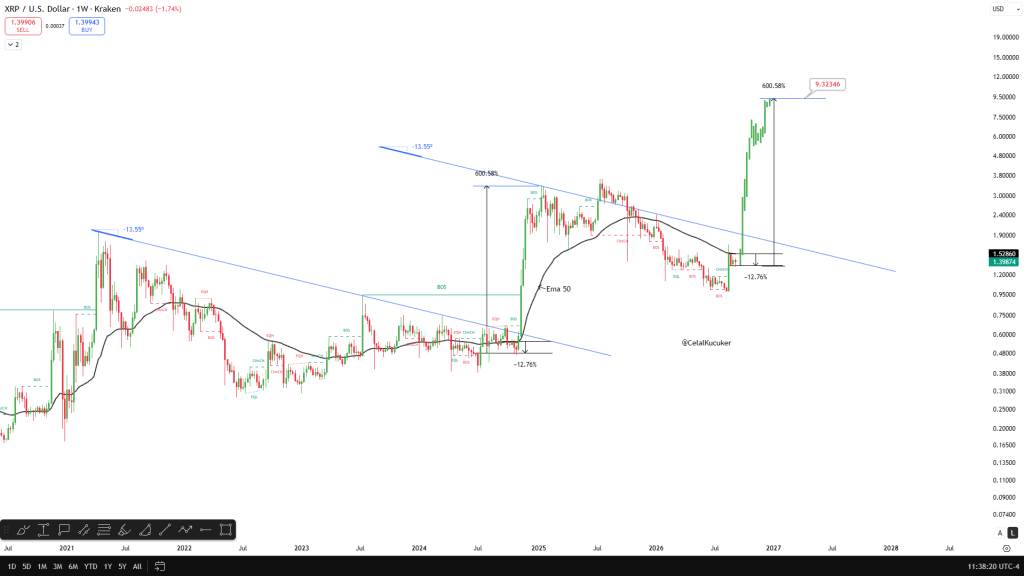 @CelalKucuker / X Both lines are labeled with an angle of 13.55°. This describes the angle drawn on the chart, not the 13.55% price decline. Chart angles also depend on the display scale, so matching labels alone cannot establish that two periods will produce equal returns.
Early structures suggest that XRP was below the moving average before strongly breaking through downtrend resistance. Celal applied a similar comparison to the current structure and charted a path towards a potential rebound of around $9.32. His chart notes both measured increases at approximately 600.58%. Therefore, this comparison is based on the assumption of repeating the early percentage expansion from the selected starting level.
Details of the XRP moving average need to be interpreted with caution
There is an important inconsistency in Celal's article. He described previous rallies starting when XRP was about 12% below the moving average, but then referred to the current trigger as being 12% above the average. The comparison areas in the figure are all marked 12.76% below the mean. In addition, the black curve is marked as "EMA 50" on the weekly chart. This means that the indicator displayed is a 50-week exponential moving average rather than the 50-day moving average mentioned in the article.
These differences are important because weekly averages track a wider period of time. Even if previous rallies start from similar positions, prices may run weak below the moving average for some time. The useful part of Celal's argument is the combination of price positions with possible resistance breakthroughs. A percentage gap below the moving average does not independently confirm that the bull market has begun. The green candles he projected represent a possible future path, they are not completed price behavior, and the $9.32 level remains a conditional chart target.
Dom identifies the $1.50 XRP price area as an instant test point
Dom provides more immediate conditions for recovery: XRP needs to recover the $1.50 area. His analysis pointed to five rejections (failed rebounds) near the area, making it an established obstacle. We looked at the XRP chart and the shaded resistance band covered the range of approximately $1.49 to $1.55. Prices fell back after several previous attempts to reach the area. The rebound in August also failed to maintain above the region. 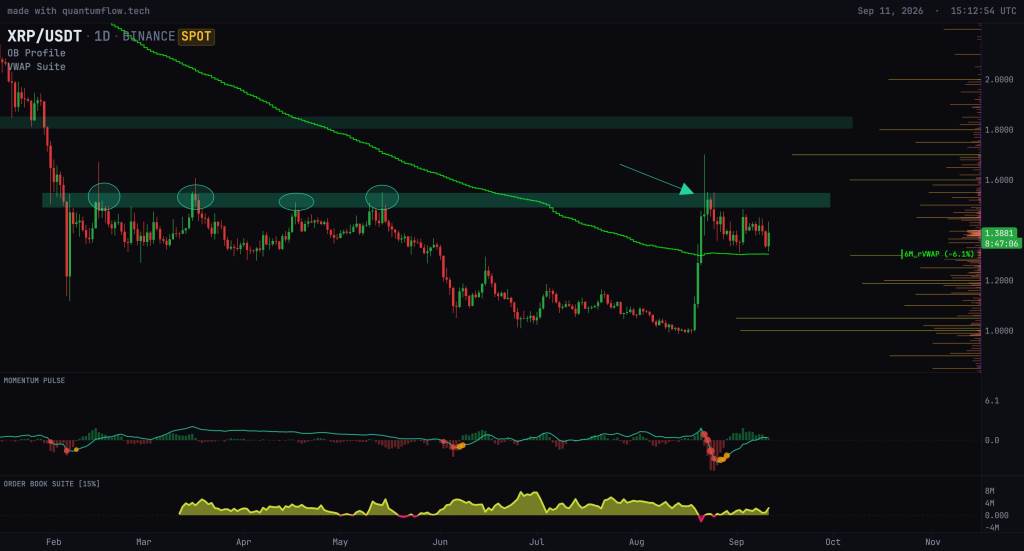 @traderview2 / X
Repeated failures suggest that XRP has difficulty maintaining demand at these price levels. Therefore, the strength of the evidence for a brief breakthrough in resistance is far less than the strength of several close rounds and successful backtests. Dom sets the lower boundary around $1.30, where its six-month rolling volume-weighted average price (VWAP) is located. This indicator calculates the average price weighted by trading volume over a rolling period. The green line is near the bottom of the recent range, and its location gives the $1.30 area additional technical relevance, although it does not guarantee that support will be effective. Dom believes that the continued recovery of the $1.50 area is the main confirmation signal that the trend is turning bullish and a bottom may have been established.
XRP prices need to be confirmed before historical comparisons strengthen
These two analyses operate in different time frames, but have one common requirement: XRP must break through resistance. Immediate levels help sort out possibilities:
- Support near $1.30: Holding this area will maintain the current trading range and keep the recovery structure intact.
- Resistance around $1.50 to $1.55:Continued breakthroughs will strengthen Dom's argument that the bottom is complete.
- is close to recent highs of $1.70: returning above this level will further demonstrate that buyers have regained control of the situation.
A break below $1.30 would weaken the recovery argument and bring back attention to the early $1.00 area. Conversely, recovering $1.50 and then $1.70 would give Celal's broader breakthrough scenario more credibility.
FAQs
Will XRP reach US$10?
Yes, it is theoretically possible for XRP to reach US$10, but it requires a huge market shift and major institutional support.
How many XRPs will be destroyed by 2030?
It is impossible to accurately predict how many XRPs will be destroyed by 2030, because the destruction of XRPs depends entirely on the volume of online transactions.