Exchange Ranking
 Top Exchanges
 24h Volume Ranking
 Popularity Ranking
 Exchange BTC Balance
 Proof of Reserves
 Decentralized Exchanges
 Funding Rate
 Funding Heatmap
 Liquidation Data
 Max Pain
 Long/Short Ratio
 Whale L/S Ratio
 Binance/Okex/Huobi L/S
 Bitfinex Margin L/S
 ETF Tracker
 Solana ETF
 XRP ETF
 Hong Kong ETF
 Bitcoin Treasuries
 Crypto Reversal
 Ethereum Reserves
 HyperLiquid Wallet Analysis
 Hyperliquid Whale Watch
 Large Transactions
 On-chain Movement
 Bitcoin ROI
 Stablecoin Market Cap
 Options Analysis
 News
News Articles
 Economic Calendar
 Features
 Wallet
 Contract Calculator


 Security
 Collections
 Watchlist
 Following
 DOT
DOT Polkadot has once again attracted market attention: the long-short game behind flexible expansion upgrades and surge in trading volume
Polkadot has once again become the focus of the market.$ DOT's 24-hour trading volume soared to more than $226 million. At the same time, BSCN highlighted Boca's new "elastic capacity expansion" upgrade, which allows a single parallel chain to push up to three blocks in a relay chain slot instead of one block in the past.
Despite rising trading volume,$DOT remained in decline this week. This price trend triggered discussions in the market about whether the current entry opportunity is "early" or "late". Market data as of September 12, 2026, based on chart timestamp at 12:21 UTC.
Today's Boka price forecast: Market Overview
Indicator Value Price $1.0454 Market Value $1.78 billion (-7.82%) Market value in circulation $1.84 billion 24-hour transaction volume $204.35 million (+24.8%) Volume/market value ratio (24h)11.45% Fully diluted valuation (FDV)$2.2 billion Total supply 1.7 billion Maximum supply 2.1 billion Circulation supply 1.7 billion Source: CoinMarketCap, as of September 12, 2026 12:21 IST. Data from other tracking sites may differ slightly.
DOT clearing data summary
Total clearing amount in the window long clearing short clearing 12 hours $143,320 $135,170 $8,150 24 hours $1.04 million $961,600 $7.58 million In two time periods, the bulls took almost all of the losses, which is consistent with the trend of $DOT falling back after rising high in early September (data from Coinglass).
Today's Cryptocurrency News: Boka Elastic Capacity Expansion Upgrade
BSCN explained that Boka's Elastic Capacity Expansion Function allows parallel chains to occupy multiple cores at once and push up to three blocks into the same trunk chain slot, instead of the usual one block per slot.
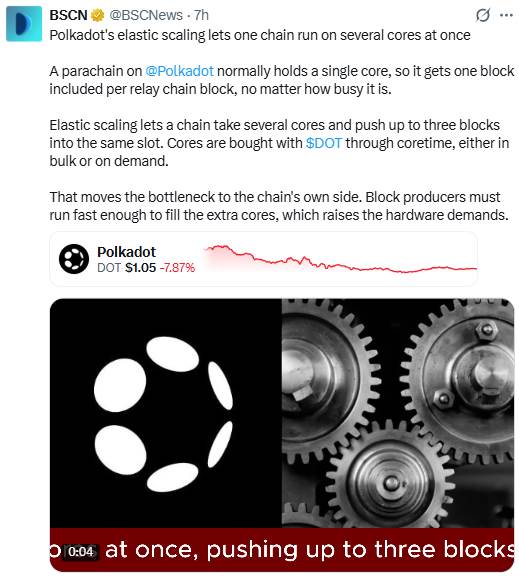 Core resources are purchased using $DOT through a system called "Coretime" and can be purchased in bulk or on demand. This shifts the performance bottleneck from the network level to the own capabilities of the block producers on the chain.
DOT trading volume surges: Today's Poca Cryptocurrency News
 Poca 24-hour trading volume has exceeded US$226 million, a significant jump. Although DOT prices remain under pressure, traders captured the change in real-time trading.
DOT Price Forecast Chart: Technical Analysis
Trading Pair: DOT/USDT · Market: Spot· Exchange: OKX · Time Frame: Daily Line (1D) · Timestamp: September 12, 2026 02:21 UTC
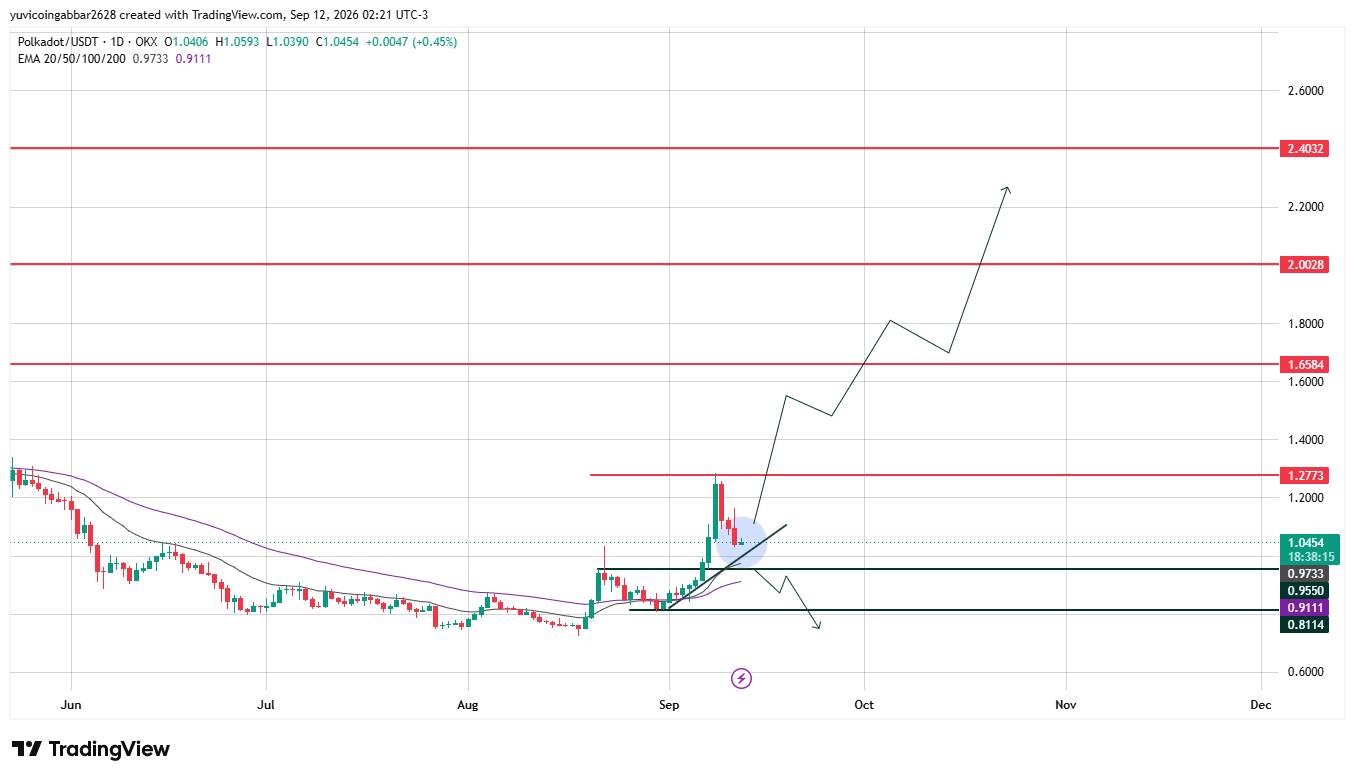
DOT is currently trading at $1.0454, remaining above the support area and near an uptrend line that is closely aligned with the 20EMA (exponential moving average), which had entered volatile territory after a sharp rise in early September.
The key factor now is whether prices can hold on to the support of the trend line or fall below it, which may determine the next trend.
 Key observation points in Boka: Forecast Analysis
Type Price Resistance 4$2.4032 Resistance 3$2.0028 Resistance 2$1.6584 Resistance 1 (Recent)$1.2773 Instant Reference Price $1.0454 First confirmed support $0.9733 Deep support $0.9550 Structural bottom $0.9111 Boka Forecast: Bull Scenario vs Bear Scenario
Bull Scenario: If we can hold $0.9733 (aligned with the EMA of the shorter cycle) and break through $1.2773, it will open up space for a path to $1.6584 or even $2.0028, and will be supported by the popularity of rising trading volume and flexible expansion.
Bear market scenario: A close below $0.9733 will expose $0.9550, followed by longer-cycle EMA support at $0.9111, with the next level below it at $0.8114. Recent long liquidations are mainly concentrated in the 12-hour and 24-hour windows, which suggests that if support falls, downside risks will still exist even if trading volumes rise.
$DOT trigger conditions and failure points
Scenario trigger conditions Possible outcome Expiration point EMA recovers close above $0.9733 pushed towards $1.2773 below $0.9111 Rejected Support held from $0.9733 rebound range continues to extend towards resistance Close below $0.9733 Support collapsed Close below $0.9111 Slide towards $0.8114 $0.9733 Recovered 2026 $DOT Price Forecast: Can I get $2.4032?
$2.4032 is the highest resistance level marked on the chart. To reach this level,$DOT must first break through $1.2773,$1.6584 and $2.0028, which is a multi-stage exercise rather than a single-leg increase.
Expert opinion: Poca price forecast
According to CoinGabbar analysts, elastic expansion and surge in trading volume are the clearest bullish signals at present, but concentrated long liquidations indicate that the market remains unstable. The range to watch this week is $0.9733 to $1.2773.
Disclaimer : This article is for reference only and does not constitute financial advice. The above levels and scenarios are based on technical chart analysis and publicly available data at the time of writing, and the crypto market can fluctuate violently within hours, so past patterns cannot guarantee future results. Before taking any action, it is worth conducting independent research and considering your own risk tolerance.