Exchange Ranking
 Top Exchanges
 24h Volume Ranking
 Popularity Ranking
 Exchange BTC Balance
 Proof of Reserves
 Decentralized Exchanges
 Funding Rate
 Funding Heatmap
 Liquidation Data
 Max Pain
 Long/Short Ratio
 Whale L/S Ratio
 Binance/Okex/Huobi L/S
 Bitfinex Margin L/S
 ETF Tracker
 Solana ETF
 XRP ETF
 Hong Kong ETF
 Bitcoin Treasuries
 Crypto Reversal
 Ethereum Reserves
 HyperLiquid Wallet Analysis
 Hyperliquid Whale Watch
 Large Transactions
 On-chain Movement
 Bitcoin ROI
 Stablecoin Market Cap
 Options Analysis
 News
News Articles
 Economic Calendar
 Features
 Wallet
 Contract Calculator


 Security
 Collections
 Watchlist
 Following
 LINK
LINK LINK has broken through a long-term downtrend line, while trading volume has increased, pushing prices towards the $10 resistance zone. If it continues to stand above $9.70, it may strengthen the recovery structure; if it is rejected, it may push the token back to lower support levels.
Chainlink's expanding role in DeFi, traditional finance (TradFi) and tokenized assets provides broader underlying support for the current market recovery.
After a long consolidation in recent trading, LINK is breaking through months of decline as buyers push prices towards $10 resistance.
Breakthrough momentum enhanced
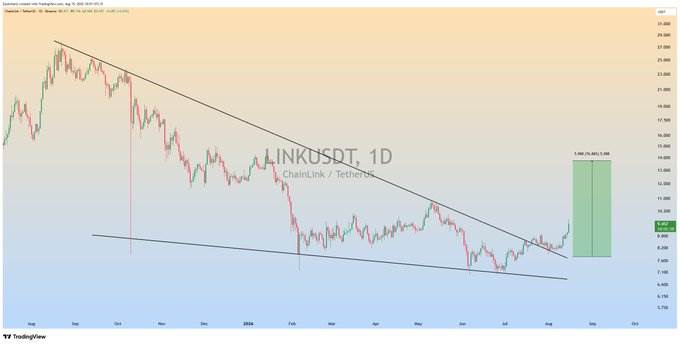
ZayK Charts reported that LINK has achieved a 16% increase after the breakthrough. In previous months, prices have formed a series of lower highs below a line of downward resistance. This breakthrough transformed the market pattern from "waiting for breakthrough observation" to "positive rise".
Source: X
The daily structure shows that the token is traded in a wide downward channel. Multiple rallies were blocked below downward resistance, while support limited deeper declines. Recently, the K-line has exceeded this long-term resistance line.
The breakthrough area is located near the upper edge of the original channel. If prices remain above this level, the new bullish structure will remain intact. If prices fall below resistance, it will weaken the current continuation market.
The chart shows that prices may move towards the $15 area. This target represents approximately 100% room for upside relative to the current breakthrough area. However, prices must first maintain momentum for this forecast to be realistic.
Momentum builds up around $10
The asset price reached $9.44, up 6.61% in the past 24 hours. The price was close to $8.82 at the beginning of the trading day, and buyers gradually took control of the situation. Since then, the momentum has accelerated rapidly and moved towards the US$9.60 -9.70 region.
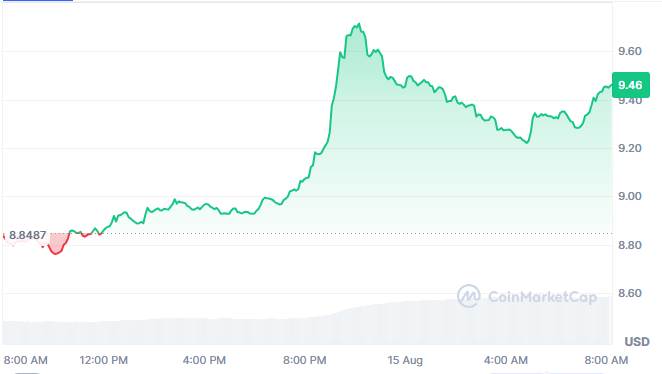
Source: Coinmarketcap
The price then fell back to around US$9.20, and then recovered to US$9.44. The rebound suggests that buyers are still active after the initial rapid rally. However, sellers are still guarding higher resistance zones.
The US$9.60 -9.70 area is currently the most recent technical test point. If we break through the region decisively, the US$10 mark will be within reach. On the contrary, if it is rejected many times, the rebound may remain in a consolidation pattern.
Trading volume in the past 24 hours was approximately US$498 million. This suggests that market participation has increased significantly as prices rise. Compared with the calm rise, active trading volume made this breakthrough more confirmation.
Chainlink's practical support structure
Ecosystem diagram shows that Chainlink serves multiple blockchain market segments. DeFi uses its oracle service to obtain reliable price and settlement data; traditional finance (TradFi) and tokenized assets extend this utility beyond decentralized markets.
The network also connects artificial intelligence, infrastructure, GameFi, NFT and encryption applications. These areas require external data, automation or cross-chain capabilities. This broad use underpins the infrastructure logic behind the token.
Coin0va describes the asset as a mature infrastructure token in the crypto space. It was noted that integration and adoption would affect long-term requirements. This framework differs from smaller tokens that are primarily driven by short-term narratives.
Market data shows its current market cap at about $7.06 billion. The circulating supply is approximately 748.09 million tokens, with a maximum supply of 1 billion tokens. The next stage depends on whether you can hold on to the breakthrough level while testing higher resistance.