Exchange Ranking
 Top Exchanges
 24h Volume Ranking
 Popularity Ranking
 Exchange BTC Balance
 Proof of Reserves
 Decentralized Exchanges
 Funding Rate
 Funding Heatmap
 Liquidation Data
 Max Pain
 Long/Short Ratio
 Whale L/S Ratio
 Binance/Okex/Huobi L/S
 Bitfinex Margin L/S
 ETF Tracker
 Solana ETF
 XRP ETF
 Hong Kong ETF
 Bitcoin Treasuries
 Crypto Reversal
 Ethereum Reserves
 HyperLiquid Wallet Analysis
 Hyperliquid Whale Watch
 Large Transactions
 On-chain Movement
 Bitcoin ROI
 Stablecoin Market Cap
 Options Analysis
 News
News Articles
 Economic Calendar
 Features
 Wallet
 Contract Calculator


 Security
 Collections
 Watchlist
 Following
 LINK
LINK Chainlink Price Forecast: A technical breakthrough unseen in years has occurred on the weekly chart
Chainlink (LINK) is happening on the weekly chart that has not occurred in many years, and this Chainlink price forecast will detail why the current timing is so eye-catching. Just as LINK broke through a trend line that had long suppressed its trend, news was circulating that some of the top giants in the traditional financial sector were sitting with the founder of Chainlink. When technical breakthroughs resonate with institutional attention, they often attract the full focus of the market. Here are all the key information worth knowing about LINK's next move.
Today's LINK price: real-time data and 24-hour changes
Currently, Chainlink's trading price is approximately US$11.38. The weekly K-line shows that prices fluctuate from the opening price of about US$11.19 to a high of US$11.435 and a low of US$11.110, with an increase of about 1.66% this week. Over the 24-hour period, CoinGlass data showed a slight correction of about 1.14%, bringing the LINK price close to $11.379 in that snapshot. This reminds us that short-term corrections still occur in larger structural movements.
The macro footprint behind Chainlink is still huge. The market value is close to US$8.51 billion, and the value of open interest is approximately US$585.4 million, indicating that derivatives traders have made a lot of layout in this round of movement. Futures trading volume in the past 24 hours was close to US$362.06 million, and spot trading volume was approximately US$83.05 million. The circulating supply is approximately 748.09 million LINKS, and the total supply and maximum supply are both 1 billion, which means that the vast majority of Chainlink's supply has entered the market.
Today's Chainlink News: BlackRock and Vanguard go with Chainlink
The current Chainlink news cycle revolves around a BSCN report stating that Chainlink founder Sergey Nazarov will attend a meeting hosted by the Federal Reserve Bank on September 24, when BlackRock, Executives from Vanguard and Sharplink will also attend. 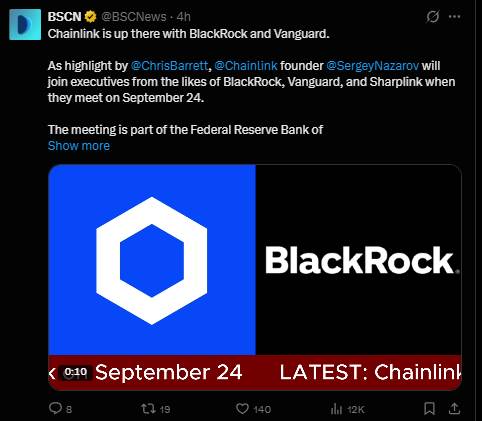 Representatives of BlackRock and Vanguard, one of the world's two largest asset management companies, sat in the same conference room as the co-founders of Chainlink. Such headlines often quickly changed market sentiment because it reinforced Chainlink's narrative of positioning itself as the core infrastructure of institutions and tokenized finance.
This type of Chainlink Today's news is directly integrated into the broader Chainlink trend analysis picture, with LINK increasingly associated with real-world asset clearing and institutional data feeds, rather than just being seen as another altcoin. Although it remains to be seen whether this particular meeting will lead to specific announcements, just in terms of visual effects-BlackRock and Vanguard's names appear in the same conversation as Chainlink-are already having an impact on market psychology.
Quick Summary
Current Market Price (CMP): 11.380
Weekly Trigger Level: Breakthrough and Close above 15.092
Weekly Failure Level:
Data as of: September 14, 2026, approximately UTC+5:30 10:45
Risk warning: This is the setting of the weekly time frame, so it is confirmed that a full weekly close is required rather than intraday fluctuations, and that the upside target above 15.092 is a broad range rather than an accurate number.
LINK Technical Prediction: Trend Line Breakthroughs that have been in the making for many years
Observe the LINKUSDT Perpetual Contract on the Bybit chart, the background here is more profound than most recent settings. 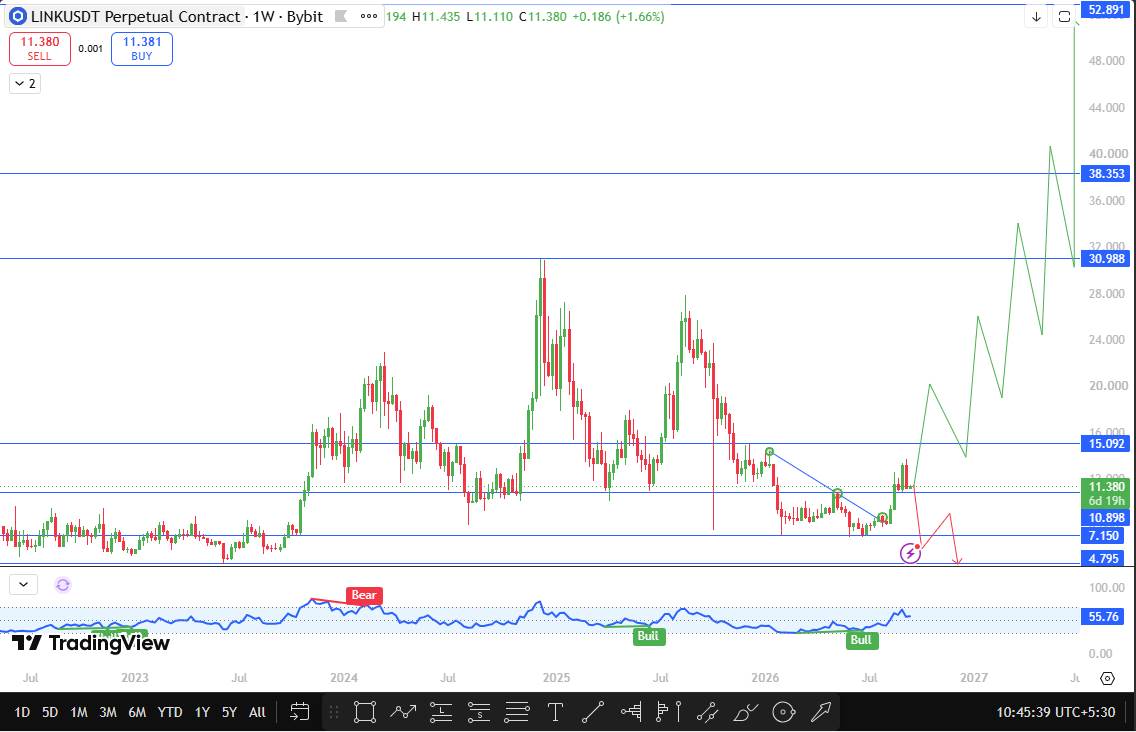 Prices recently retested the exact range Chainlink maintained between May 2022 and October 2023, and since that retest, LINK has now broken through the downtrend line that has suppressed every rebound since then. This trend-line breakthrough, which spans years of price movement history, usually has more technical weight than short-term models because it reflects a real shift in the balance between long-term buyers and sellers rather than a short-term squeeze.
Weekly oscillators also support the shift, currently above the midline and showing bullish signals at recent higher lows, which contrasts with the bearish divergences that occurred earlier during the 2022 decline. This combination-a multi-year trend-line breakout combined with momentum for improvement-is exactly what happens in serious Chainlink technical analysis when we consider rather than ignore longer-term trend changes.
The next major decision point is at 15.092. If LINK can break through and close above that level on a weekly basis, buyers may become fully active. Given the current news about BlackRock and Vanguard, this institutional focus could become the real fuel for driving such movements rather than just a temporary narrative. After that, the next resistance zones are at 30.988 and 38.353, both representing huge increases relative to current prices that may take a considerable amount of time to reach even in a strong bull market scenario. Above that, 52.891 is the main resistance level on the chart, in large part because Chainlink's all-time high is nearby, making it a natural ceiling that won't be easily breached unless proven.
On the downside, if the price breaks below and closes below 7.150, it means that the breakthrough attempt failed to stand firm, and the next support level to pay attention to is 4.795. Given that this is a significant pullback from the current structure, Chainlink is still likely to see a rebound here.
Chainlink price forecast: Support and Resistance
Type Price Distance CMP Main Resistance (Near Historical High) 52.891+364.8% Resistance 238.353+237.1% Resistance 130.988+172.3% Breakthrough Trigger 15.092+32.6% Current Price 11.380-Support 17.150-37.2% Support 2 (rebound zone) 4.795-57.9% Chainlink's bull market, benchmark and bear market scenarios
Bull market scenarios: LINK maintained its recent trend-line breakthrough and finally achieved a weekly close above 15.092, confirming that buyers have taken control of the structure. If this happens, and accompanied by continued positive Chainlink news, especially the specific results of the September 24 meetings with BlackRock and Vanguard, this Chainlink price outlook is expected to extend to 30.988 over the longer term, with 38.353 and the main 52.891 areas being longer-term goals.
Baseline scenario: LINK consolidates between the support level of 7.150 and the trigger level of 15.092, while the market digests technical breakthroughs and institutional headlines, waiting to either confirm the weekly close above the resistance level, or explicitly reject it and fall back into the old range.
Bear market scenario: If 7.150 falls below the weekly close, it indicates that the trend line breakthrough was a fake action rather than a real trend shift. In this case, 4.795 becomes the next level to focus on, and given the deep support level, it is consistent with the area in LINK's history where it has found buyers willing to re-enter.
Risks of this LINK price outlook
This is a forecast for a weekly time frame, meaning it will unfold in weeks or even months, rather than days, and recent volatility may be very different from the overall trend. Current connections between BlackRock and Vanguard are based on attendance at scheduled meetings rather than confirmed partnerships or product announcements, so if nothing specific is announced on September 24, the news stream is likely to cool. The broader crypto market environmental conditions, especially Bitcoin dominance and overall risk appetite, may also easily override individual altcoin settings like this, no matter how perfect the chart shape may seem.
Key term glossary
Downtrend line: A downwardly sloping line connecting a series of lower highs, usually serving as resistance before being decisively breached.
Weekly close: The final price at the end of the trading week is used to confirm whether a breakthrough or break is real, rather than a temporary shadow.
Open interest: The total number of derivative contracts that remain open and unsettled at a given time.
Bullish divergences: The pattern of prices hitting new lows and momentum indicators hitting lower lows usually indicates weakening downward pressure.
Historical highs (ATH): The highest price ever reached by an asset, often serving as a strong psychological resistance.
Disclaimer
This article is for reference only and should not be regarded as financial advice. Chainlink price forecast data, LINK price target levels and all technical analysis shared here are based on chart models and publicly available data at the time of writing. The cryptocurrency market is extremely volatile, and prices may fluctuate violently without warning. Before making any investment decisions involving LINK or any other digital asset, be sure to research and consult a qualified financial adviser yourself.