Exchange Ranking
 Top Exchanges
 24h Volume Ranking
 Popularity Ranking
 Exchange BTC Balance
 Proof of Reserves
 Decentralized Exchanges
 Funding Rate
 Funding Heatmap
 Liquidation Data
 Max Pain
 Long/Short Ratio
 Whale L/S Ratio
 Binance/Okex/Huobi L/S
 Bitfinex Margin L/S
 ETF Tracker
 Solana ETF
 XRP ETF
 Hong Kong ETF
 Bitcoin Treasuries
 Crypto Reversal
 Ethereum Reserves
 HyperLiquid Wallet Analysis
 Hyperliquid Whale Watch
 Large Transactions
 On-chain Movement
 Bitcoin ROI
 Stablecoin Market Cap
 Options Analysis
 News
News Articles
 Economic Calendar
 Features
 Wallet
 Contract Calculator


 Security
 Collections
 Watchlist
 Following
 SUI
SUI Analysts pointed out: The SUI 12-hour TD series indicator sends a new buy signal, and prices are testing the US$0.70 -0.72 support area
SUI must recover US$0.75, followed by the US$0.78 -0.85 range; and Michael van de Poppe believes that returning to US$0.85 is the key to achieving the US$1 target. Although RSI and MACD show initial signs of improvement, if US$0.70 support is lost, SUI could be exposed to downside risks of US$0.64 and US$0.60.
SUI is currently trading close to US$0.72 after retreating from US$0.85, while analysts are closely watching support around US$0.70. Ali Charts reported that the TD series indicator sent a new buy signal. At the same time, Michael van de Poppe and Investor Jordan pointed to different price levels that could shape the next step of SUI.
Analysts focus on SUI support levels
Ali Charts said that the TD series indicator has accurately identified the main trend changes on the SUI 12-hour chart. The previous signal came after a 17% gain and signaled a shift in momentum. Now, with SUI trading around $0.71, the indicator is sending a buy signal again.
However, Michael van de Poppe said that after a full retest, SUI needs to hold on to the current support area. He identified $0.85 as an important recovery level. According to van de Poppe, a return to $0.85 could cause prices to break through the $1 mark.
Investor Jordan takes a more cautious view. He said SUI had lost its bullish momentum and returned to its daily support level near $0.70. Jordan also revealed that he invested just over $100,000 in SUI.
SUI prices remain below recent highs
SUI currently trade at US$0.7234. The latest K-line opened at US$0.7167, hitting a high of US$0.7280 and dropping to US$0.7151. The overall structure is still in a correction stage after SUI rose from about $0.65 in late August.
The token reached a high of about US$0.84 -0.85 in early September, and then began to continue to decline. The price later returned to the $0.72 region again. The current immediate trend is bearish to neutral, although the recent K-line shows signs of attempts to stabilize.
Immediate support is around $0.715 -0.720, followed by $0.70. A deeper decline could expose the $0.68 -0.65 area. On the upside side, SUI must first recover US$0.75, followed by resistance levels of US$0.78 -0.80 and US$0.82 -0.85.
Momentum indicator shows preliminary improvement
The RSI is currently at 44.45, above its moving average of 35.94. However, it is still below the neutral 50 level. The MACD bar graph is positive 0.0019, while the MACD line is-0.0135. 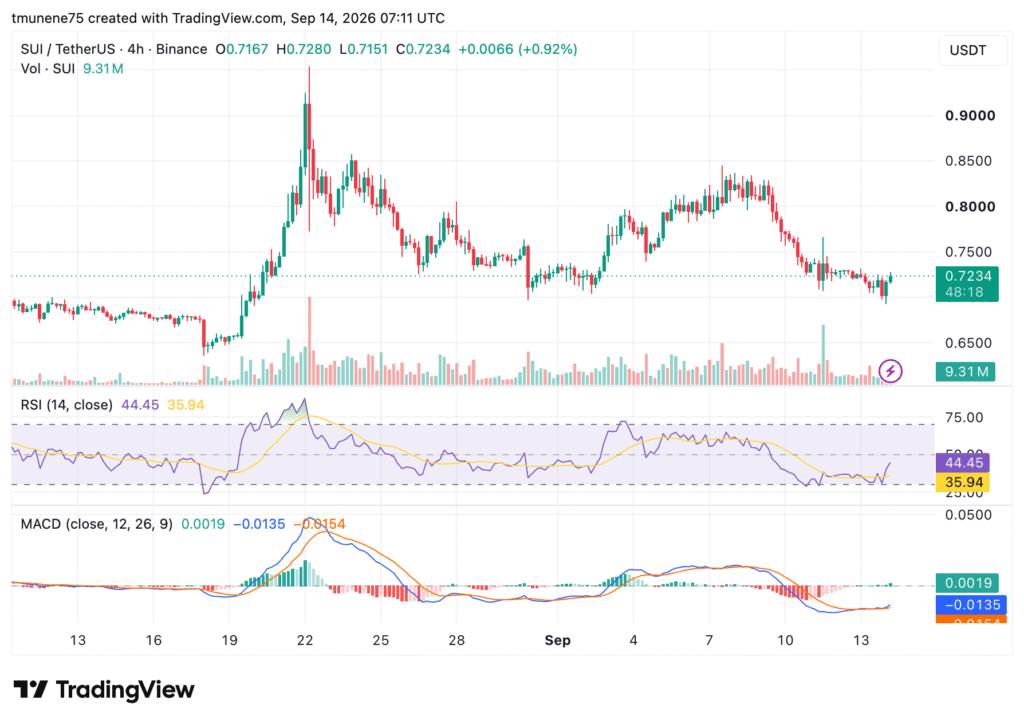 The MACD line has moved above the signal line (approximately-0.0154). The transaction volume was approximately 9.31 million. Jordan said that if it falls below $0.70, SUI may face the test of $0.64 and $0.60. He added that if buyers can defend the area, he may increase his holdings.