Exchange Ranking
 Top Exchanges
 24h Volume Ranking
 Popularity Ranking
 Exchange BTC Balance
 Proof of Reserves
 Decentralized Exchanges
 Funding Rate
 Funding Heatmap
 Liquidation Data
 Max Pain
 Long/Short Ratio
 Whale L/S Ratio
 Binance/Okex/Huobi L/S
 Bitfinex Margin L/S
 ETF Tracker
 Solana ETF
 XRP ETF
 Hong Kong ETF
 Bitcoin Treasuries
 Crypto Reversal
 Ethereum Reserves
 HyperLiquid Wallet Analysis
 Hyperliquid Whale Watch
 Large Transactions
 On-chain Movement
 Bitcoin ROI
 Stablecoin Market Cap
 Options Analysis
 News
News Articles
 Economic Calendar
 Features
 Wallet
 Contract Calculator


 Security
 Collections
 Watchlist
 Following
Silver performed well last week, rising about 5% from US$58 an ounce to the US$63.50 - 64.10 range. Weak U.S. employment data has led to expectations that the Federal Reserve will not tighten monetary policy significantly, providing support for silver prices. Falling Treasury yields and a weakening U.S. dollar also boosted precious metals, allowing silver to rebound from monthly support of $55.80.
Right now, the rally is encountering resistance near US$63, a key pressure area on the weekly chart. During the week from August 10 to 16, the core issue of market concern was: Can silver prices break through this resistance level, or do they need to consolidate first?
U.S. CPI, PPI, retail sales, consumer confidence index and 10-year Treasury bond auction data will be released this week. Therefore, the direction of silver prices depends largely on yields and the subsequent performance of the dollar.
News that could push silver prices this week
U.S. inflation data will be the main macro catalyst. The calendar shows that the CPI is 3.4% year-on-year, the core CPI is 2.5% year-on-year, and the monthly CPI is 0.2%. If the inflation data is soft, it will reduce the pressure on government bond yields and the US dollar, thereby benefiting silver.
Producer prices and consumer data are equally important. Core PPI is forecast at 0.3%, PPI at 0.2%, unemployment claims at 202,000, retail sales at 0.1%, and core retail sales at 0.2%. If both economic growth and inflation data are weak, expectations of interest rate cuts will be strengthened and silver prices will be supported.
The auction of 10-year Treasury bonds, crude oil inventory data and the University of Michigan Consumer Confidence Index will increase market volatility. The initial forecast for consumer confidence is 54.4, and inflation expectations are 4.2%. Therefore, if yields strengthen or inflation concerns intensify, it may limit the upside of silver prices.
Signals displayed on the silver chart
We looked at the chart and found that silver prices have rebounded from the $55.80 monthly PD array, the main support area in this round of decline. Since then, silver prices have climbed all the way to $63.60, hitting strong weekly resistance around $63.
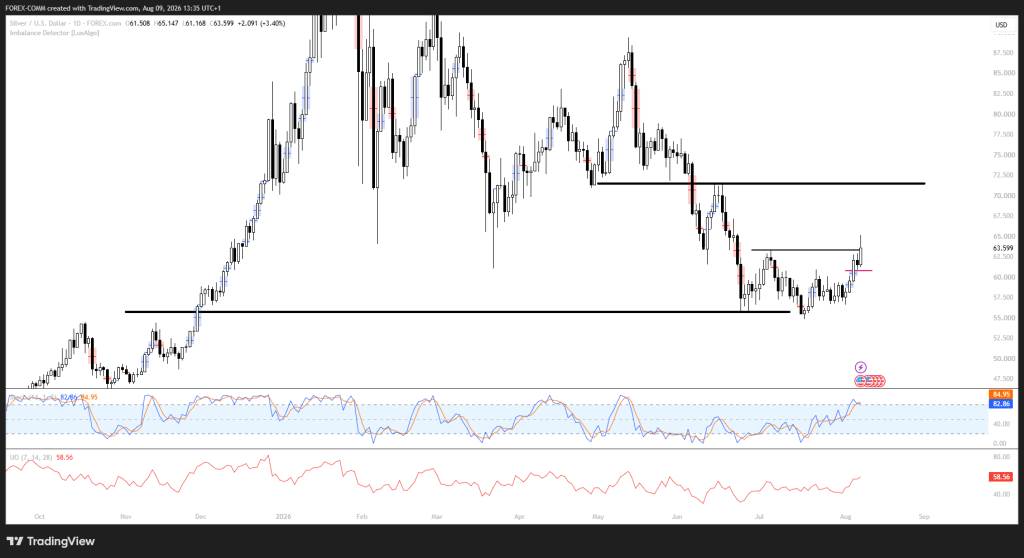
The latest round of gains has pushed silver prices past short-term resistance around US$61, but the US$63 - 64 region remains the main test. The chart shows that silver prices have been blocked in this region before. If the daily close can stabilize above the region, the bulls may target the next main target.
The kinetic energy indicator performed well, but the stochastic indicator has risen to 82.86, with its signal line at 84.95. This means that if the bulls fail to break through US$63 - 64, silver prices may enter a sideways consolidation or face a correction.
The ultimate oscillator is at 58.56 and kinetic energy remains above the neutral region. If the US$63 resistance level is effective, the first downside target is the US$58 - 60 daily area; if this support level is held, the overall structure may push silver prices towards the US$71 monthly target.
Where will silver prices go this week?
Bullish situation:
The daily line closed firmly above US$63 - 64, confirming that the bulls have cleared the weekly obstacles. By then, silver prices may target $65 - 67, with a larger target of $71.
Neutral scenario:
If US$63 - 64 continues to suppress bulls, silver prices may consolidate between US$58 and US$63. Holding the daily support of US$58 - 60 will keep the overall rebound pattern intact.
BELOW Scenario:
Failure to hold on to US$58 will weaken the current structure and the US$55.80 monthly PD array will return to focus. A fall short of this level could open up room for a decline towards $52 - 50.
FAQs
What is the silver price forecast this week?
 If silver breaks through and stabilizes in the US$63 resistance zone, it may target US$71. If blocked, silver prices may fall back to $60 - 58.
What were the main factors driving silver prices this week?
The main drivers include U.S. inflation data, Treasury yields, U.S. dollar movements and Federal Reserve interest rate expectations. If CPI or PPI data is soft, expectations for interest rate hikes may be lowered, thereby supporting silver prices.
Can silver prices reach US$71 this week?
It is possible, but silver prices first need to break through the weekly resistance of US$63 and stand firm. If US$58 - 60 remains strong after the correction, the path to US$71 will be more credible.