Exchange Ranking
 Top Exchanges
 24h Volume Ranking
 Popularity Ranking
 Exchange BTC Balance
 Proof of Reserves
 Decentralized Exchanges
 Funding Rate
 Funding Heatmap
 Liquidation Data
 Max Pain
 Long/Short Ratio
 Whale L/S Ratio
 Binance/Okex/Huobi L/S
 Bitfinex Margin L/S
 ETF Tracker
 Solana ETF
 XRP ETF
 Hong Kong ETF
 Bitcoin Treasuries
 Crypto Reversal
 Ethereum Reserves
 HyperLiquid Wallet Analysis
 Hyperliquid Whale Watch
 Large Transactions
 On-chain Movement
 Bitcoin ROI
 Stablecoin Market Cap
 Options Analysis
 News
News Articles
 Economic Calendar
 Features
 Wallet
 Contract Calculator


 Security
 Collections
 Watchlist
 Following
 BTC
BTC  ETH
ETH Ethereum is currently trading at $2,389, up 2.73% during the day. It opened at $2,326 and hit a high of $2,396. The intraday high is only $4 short of $2,400, and this level has suppressed every rally since April this year. 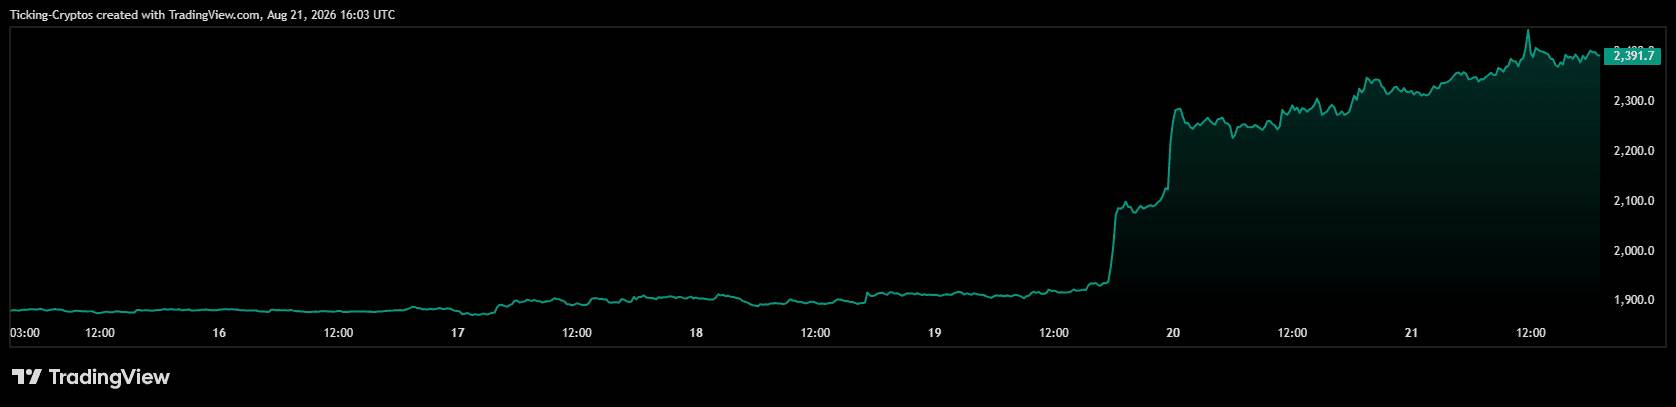
Ethereum dollar price
The overall figures conceal what actually happened. Ethereum surged from about $1,900 to nearly $2,400 in three trading days, gaining about 25% this week, setting the largest one-day gain since May 2025. More importantly, Ethereum is not simply following Bitcoin's rise, but leading Bitcoin. For an asset that will underperform the market for most of 2026, this reversal is the real story.
Why did Ethereum price exceed $2,300?
Ethereum exceeded $2,300 because funds shifted from Bitcoin to Ethereum for the first time in this cycle, and the circulation supply of Ethereum has been quietly shrinking this year. The initial trigger was shared with other assets in the market, but the subsequent trend was completely different. On August 20, Ethereum surged nearly 20% in a single day, setting the largest one-day gain since May 9, 2025, far exceeding Bitcoin, which rose nearly 10% over the same period.
This gap is the key. Ethereum's beta coefficient is higher than Bitcoin, which means that it fluctuates more in both directions when market conditions change. But beta alone cannot explain a week's 25% increase. There are three specific mechanisms at work behind it.
Reason 1: What does the ETH/BTC breakthrough signal mean?
The ETH/BTC ratio has exceeded its multi-month bottom zone, the earliest and most reliable signal of market leadership shifting from Bitcoin to Ethereum. 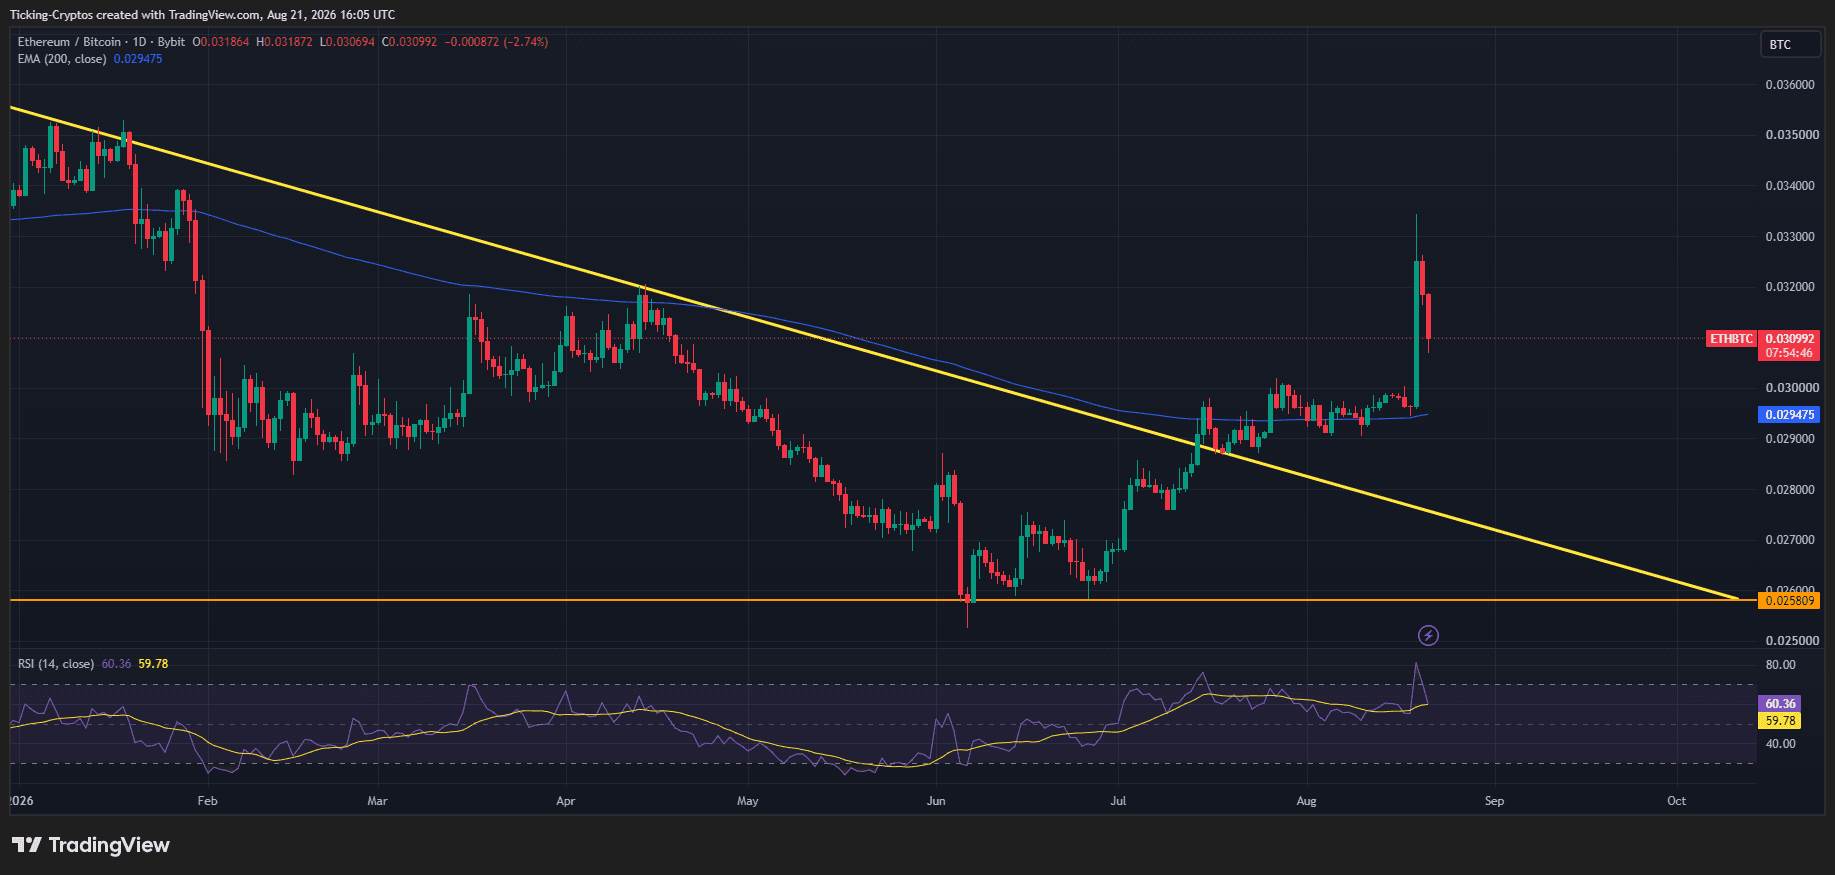 For most of 2026, the ratio will hover near multi-year lows. Ethereum's decline exceeded Bitcoin's roughly 52% retracement, continuing years of weak performance relative to market leaders. Every rebound in Ethereum this year has not lasted because the ratio continues to decline, meaning that even as the dollar price rises, funds are still leaving Ethereum.
The situation has changed now. The ETH/BTC daily chart formed a cup handle shape between May and July, with the bottom close to 0.0254 BTC and the neck line close to 0.0298 to 0.0300 BTC. If the daily closing price firmly stands above 0.0300 BTC, the target will point to 0.0345 to 0.0355 BTC. Analyst Michaël van de Poppe pointed out that the currency pair once touched 0.033 BTC during this round of gains.
Why this is more important than the dollar chart: If the ratio holds the breakthrough, Ethereum can continue to rise even if Bitcoin moves sideways. This is completely different from the market structure where Ethereum can only be driven by Bitcoin. Fundstrat's Tom Lee believes that Ethereum's downwind factors will exceed previous ICO and NFT cycles in the next few years, and expects the ETH/BTC ratio to rise significantly.
(Note: The original guiding text here about the promotion of account opening has been hidden as required. Original text: There is a paragraph about risk warnings for CFDs at the end of  . This content involves specific platforms and products and is a guidance content that needs to be hidden, so it is deleted together.)
Reason 2: How can the shrinking supply of Ethereum amplify the increase?
Ethereum's tradable supply on exchanges is at historically low levels because a large number of tokens are locked in pledge contracts and the Layer-2 network. Therefore, the same scale of purchased funds has a far greater driving force on prices than two years ago. This is a driving factor that most reports ignore and is entirely unique to Ethereum-Bitcoin has no similar mechanism. Exchange inventories are at historically low levels as assets are locked in the Layer-2 network and pledge agreements, greatly amplifying the rally.
The mechanism is simple: Pledged ETH will not appear in the order book, nor will ETH bridged to the Layer-2 ecosystem. When demand poured in, they competed for a thinner pool of instant saleable tokens than the total supply would suggest. Coupled with leverage, it will cause violent fluctuations. A $1.9 billion short clearing and a chain of short-selling positions forced leveraged traders to liquidate their positions, and as prices accelerated, 24-hour trading volume reached $38 billion. ETH open interest volume soared to US$13 billion during this round of gains.
What needs to be vigilant is that the reverse effect of this mechanism also exists. Weak circulation is a double-edged sword. The structure that drives the rise will also make any correction quick because there is not enough deep support for pending orders below.
Reason 3: Is ETF capital flows finally turning to Ethereum?
Yes, the spot Ethereum ETF has once again attracted large inflows, and the September regulatory calendar has a far greater impact on Ethereum than Bitcoin. On August 19, the net inflow of spot Ethereum ETF was US$189 million, boosting this round of gains. This figure builds on an earlier shift: the Ethereum ETF had net inflows of approximately $71 million in the week of July, compared with a net outflow of approximately $200 million in the same period, marking the third consecutive week of net inflows for the Ethereum ETF.
Concentration is worth paying attention to. BlackRock's ETHA funds control approximately 68% of the assets of the U.S. spot Ethereum ETF, with institutional funds flowing in through the cheapest and most liquid instruments. Money flowing to Ethereum actually goes to a single fund, which makes the data easier to track, but if the fund turns, risk will also be more concentrated.
On the regulatory front, Ethereum faces more uncertainty than Bitcoin. The Senate's first procedural vote on the CLARITY Act is scheduled for September 15, 2026. If passed, it will open a debate on the framework that determines how DeFi and Ethereum-related perpetual contract exchanges are regulated. Bitcoin's regulatory status is basically settled, and Ethereum's DeFi and pledge ecosystem are the objects of the bill.
What does the Ethereum chart show at $2,400?
Ethereum has regained its 200-day exponential moving average (EMA) of $2,128 and is currently facing direct suppression of $2,400-where every rally since April has been blocked. 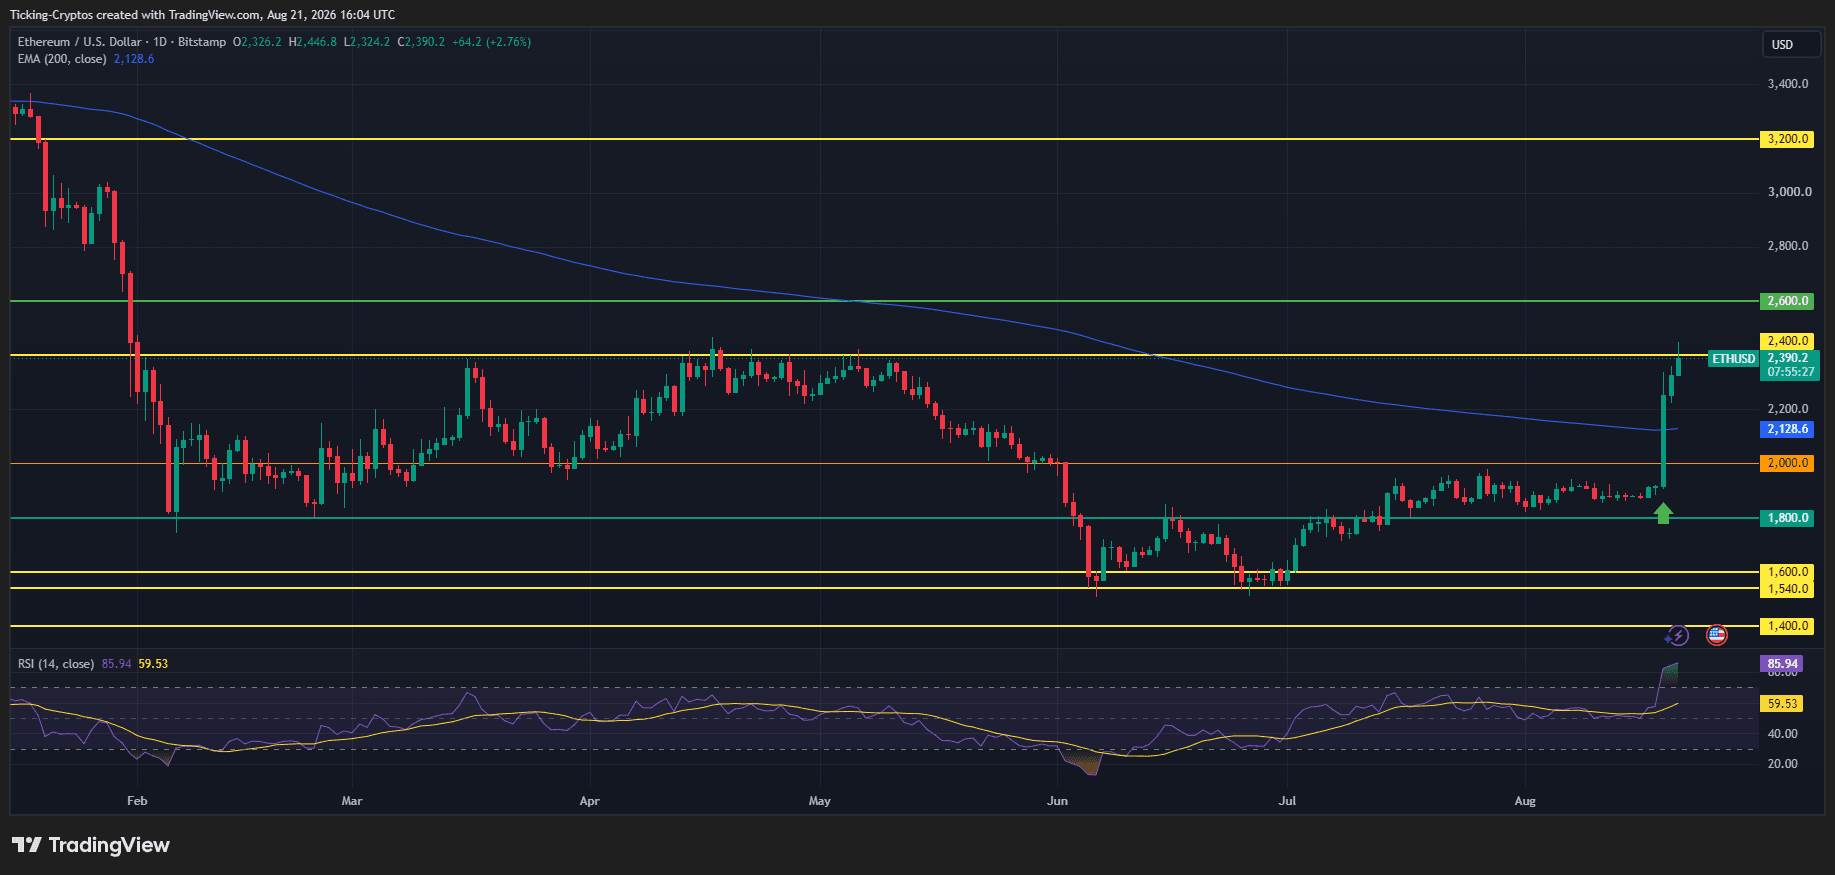 The structure has completely changed. Starting from June, ETH is locked between approximately $1,800 and $2,000, with the $1,600 and $1,540 areas forming the lower edge, and $1,500 being the panic low in June. The current K-line broke through all these prices in one fell swoop, breaking through the downward 200-day EMA of $2,128 in a single day and stopping directly below $2,400.
Today's K-line opened at $2,326, with a low price of $2,324, and there were almost no decline transactions. This suggests sellers have not yet shown themselves at these levels, which is unusual after a week of gains of 25%. The obvious problem is momentum: the daily RSI is 85.92 and the signal line is 59.53. This reading is more extreme than Bitcoin's reading in the same rally and is one of the highest readings on the entire Ethereum chart. Readings above 85 are almost never resolved through continued vertical gains, but are absorbed through a sharp correction or sideways consolidation, while indicators cool down.
What is the next target price for Ethereum after breaking through $2,400?
A daily close above $2,400 opens the path directly to $2,600 with little structural resistance in between.$ 2,400 is the mark-it suppressed Ethereum in April and early May, and the price is now just a few dollars below it. If the closing price stands higher, the position will turn from resistance to support, with the next target price of $2,600, which is about 8.8% higher.
This interval is interesting because it is very thin. During the spring decline, ETH stayed between $2,400 and $2,600 for a short time, so there wasn't much trapped supply waiting to sell off in the rebound.
(There is a table in the original text here, which has been transformed into descriptive text: starting from $2,389,$2,400 distance +0.5%, the role is the barrier and must close;$2,600 distance +8.8%, is the next mapped resistance, the space above is sparse;$2,128 distance-10.9%, is the 200-day EMA trend line;$2,000 distance-16.3%, is psychological support and the top of the old range;$1,800 distance-24.7%, which is structural support, which is the bottom from June to August.)
Where does the bullish Ethereum setting expire?
This setting expires when the daily close again falls below the 200-day EMA of $2,128, which is the last line of defense before the entire round of gains is completely erased. Being blocked at $2,400 and failing to close will be the first warning sign. That alone will not destroy the structure-it is normal and healthy for a retracement test to regain the EMA after such a steep rise. But losing $2,128 is different, which would put Ethereum back below the line that defines its long-term trend, and is strongly inclined to view it as just a liquidation-driven surge rather than a real funding rotation.
Need to maintain perspective: Ethereum is still far from recovered. Since 2026, Ethereum has still fallen sharply, well below its peak of nearly $5,000 in 2025. A rise to $2,600 would be a strong rebound in a bear market rather than a return to previous highs.
Ethereum Price Forecast: Can ETH reach $2,600?
$2,600 is achievable in the next few weeks, provided that the ETH/BTC ratio holds the breakthrough-because that is the key to distinguishing true rotation from a beta-driven rally. Bullish logic has three mutually reinforcing pillars: the outflow of funds from Bitcoin provides ETH with buying orders that do not rely on BTC rises; locked liquidity allows buying orders to efficiently drive prices; and the September CLARITY vote provides the DeFi ecosystem with specific catalysts that Bitcoin does not have.
The bearish logic is equally clear: the RSI is close to 86 and is overstretched by any standard; most of the driving force comes from forced short covering rather than spot accumulation; and the ETF flow story, while true, relies on a single dominant fund. If the ETH/BTC ratio falls below the breakthrough level, rotation theory will collapse and ETH will become a high-beta proxy asset for Bitcoin again.
The most favorable result is a pause. A consolidation between $2,128 and $2,400 to cool the RSI while the ratio remains stable will establish a better foundation for a hit to $2,600 than another round of vertical pull-up. There are two things to focus on: the relationship between the daily closing price and $2,400, and whether the ETH/BTC ratio holds a breakthrough. The dollar chart tells you what happened, and the ratio tells you whether it will last.