Exchange Ranking
 Top Exchanges
 24h Volume Ranking
 Popularity Ranking
 Exchange BTC Balance
 Proof of Reserves
 Decentralized Exchanges
 Funding Rate
 Funding Heatmap
 Liquidation Data
 Max Pain
 Long/Short Ratio
 Whale L/S Ratio
 Binance/Okex/Huobi L/S
 Bitfinex Margin L/S
 ETF Tracker
 Solana ETF
 XRP ETF
 Hong Kong ETF
 Bitcoin Treasuries
 Crypto Reversal
 Ethereum Reserves
 HyperLiquid Wallet Analysis
 Hyperliquid Whale Watch
 Large Transactions
 On-chain Movement
 Bitcoin ROI
 Stablecoin Market Cap
 Options Analysis
 News
News Articles
 Economic Calendar
 Features
 Wallet
 Contract Calculator


 Security
 Collections
 Watchlist
 Following
 ADA
ADA  AGI
AGI  BCH
BCH  BTC
BTC  DENT
DENT  DOGE
DOGE  ETH
ETH  ONG
ONG  SOL
SOL  XLM
XLM  XMR
XMR  XRP
XRP  ZEC
ZEC  VELVET
 Quick overview
1. Bitcoin hit $81,257 on August 25, its highest price since mid-May, before falling back to about $79,000, extending a seven-day gain of about 25%.
2. In the week ending August 21, the net inflow of U.S. spot Bitcoin ETF was approximately US$1.92 billion, which was the strongest single-week inflow since October 2025, and achieved net inflow for five consecutive trading days.
3. The rally began with a short squeeze, with the daily RSI rising above 84 and 84 components of the QC100 index falling. As a result, the rally requires the market to accept $80,000 as support, rather than just a one-time breakthrough.
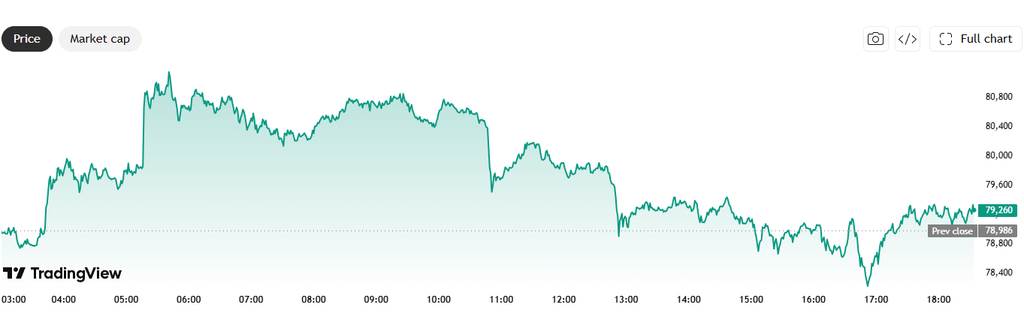
Bitcoin fell back after hitting US$81,257 in Tuesday trading, breaking the US$80,000 mark for the first time since mid-May and setting a 15-week high. The token then fell back to about $79,000, making the $80,000 integer mark a key level in determining whether the move was a breakthrough or an overshoot.
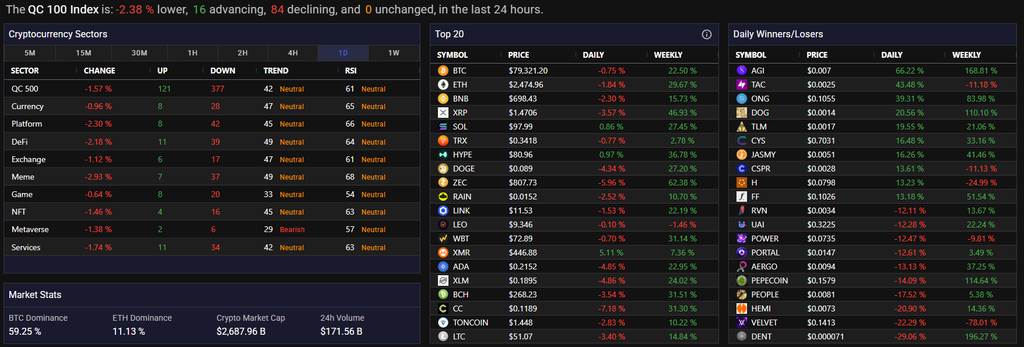
According to CoinGecko's real-time price data, the total market value of the crypto market reached US$2.69 trillion, with a 24-hour trading volume of US$171.56 billion. According to QuantifyCrypto data, Bitcoin's market share is 59.25%, and Ethereum's market share is 11.13%. The detail worth noting is market width: In the QC 100 index, 84 stocks fell, while only 16 rose.
How did Bitcoin rise from $64,000 to $81,000?
Within eight trading days, it experienced a breakthrough, a weekend correction and a new round of gains. In this process, the path is more important than the end point, because the driving factors for each trend are different.
The rally began last week, with prices starting at about $64,000. At that time, the U.S. Treasury Department announced that it would increase the limit on long-term bond repurchase from US$2 billion per time to at least US$4 billion starting from September 9. Long-term yields fell, risky assets collectively rose, and approximately $2.7 billion in short cryptocurrency positions were liquidated. Bitcoin broke through $70,000 within hours, and then exceeded $75,000. Over the weekend, the market saw a correction that matched the pace of gains, and prices fell back to $75,500. Buyers returned to the market after the weekday started and pushed prices above $81,000 on Tuesday morning before the rally stalled.
Bitcoin has risen about 38% from a low below $58,000 at the end of June. Over an eight-day span, the increase was about 28%, which increased its market value by about $350 billion to about $1.6 trillion.
Is Bitcoin's rise supported by real buying?
Partly, this is a candid answer rather than ambiguous. There are two different funding flows at work, but only one of them is sustainable.
The first is forced to buy. Short squeeze drove the initial gains, as traders who were betting that Bitcoin would remain below $67,000 were quickly closed. CoinGlass data shows that approximately $452 million in short positions have been liquidated in the last 24 hours alone.
Short squeeze refers to the forced buying behavior caused by an exchange automatically closing its short positions when prices move in a direction that is unfavorable to short sellers. This is a real buy, but with limited fuel.
Voluntary buying is the reason why this rally is different from a simple short squeeze. In the week ending August 21, the U.S. spot Bitcoin ETF recorded a net inflow of approximately US$1.92 billion, the strongest week since October 2025, with net inflows of funds for five consecutive trading days. Daily traffic data is publicly disclosed by Farside Investors and SoSoValue, which means investors can verify the persistence of inflows rather than just guessing.
It is necessary to point out the limitations of this data: a strong week only suggests that spot demand has returned during the rally, and does not prove that the same buyers will return when prices rise by 25%. Moreover, a single week's data does not constitute a trend.
What warning signs are there?
The momentum indicator is already at high levels, and the key level of US$80,000 has not yet been confirmed by the market. The daily RSI has risen above 84, and the flow of funds index is close to 77.22, both in ranges that normally signal market consolidation rather than continued gains.
Position data reveals a similar situation from another perspective. Glassnode pointed out that bitcoin's option skew has dropped to its lowest level during the year, and the front-end skew has even turned negative, which means traders are willing to pay higher fees for call options than for put protection. This is a sign of market enthusiasm, and this enthusiasm at 15-week highs is often a configuration that can trigger a sharp correction.
Fundstrat's Tom Lee predicted a short-term range of $74,000 to $81,000, indicating that current prices are at the top of the expected consolidation range rather than the starting point for a new round of gains.
What prices are the key now?
$80,000 at the top and $75,500 at the bottom. Before these two prices were broken, the rest was noise.
If the market accepts US$80,000 as support-i.e., a firm daily close rather than just an intraday breakthrough-then the US$82,000 to US$87,000 area will be opened, with less recent trading records. If that level is not held, especially if ETF inflows slow, prices could fall back to $75,500, the weekend low buyers successfully defended last week.
This website tracked the $60,000 to $64,000 range in July and set two conditions to determine whether a breakthrough was effective: the daily closing price stabilized above the old resistance level, and the volume remained persistent. Both conditions were met at the time, and Bitcoin subsequently rose by about 25%. The same two conditions and logic apply to the $80,000 mark. As a background, to understand how much room there is for this rally, Bitcoin is still about 36% below the all-time high of about $126,000 set in October 2025.
Which altcoins follow Bitcoin's rise?
There are almost none today, and that's the key. All ten sectors tracked fell, with Meme coin falling the most, at-2.93%, platform coin falling 2.30%, and DeFi sector falling 2.18%.
Monero was the exception among the broader currencies, rising 5.11% on the day to US$446.88, while almost all other currencies fell. Hyperliquid maintained a 0.97% gain at $80.96;Solana rose 0.86% to $97.99, slightly below the $100 mark it broke earlier in the session.
All other currencies fell. Ethereum fell 1.84% to US$2,474.96; Ripple fell 3.57% to US$1.4706; Dogecoin fell 4.34%; Cardano fell 4.85%;Stellar fell 4.86%;Zcash took back 5.96% to US$807.73.
Weekly data shows the opposite picture and should be observed together with daily data. In the past seven days, Zcash has gained 62.38%, Ripple has gained 46.93%, Hyperliquid has gained 36.78%, Bitcoin Cash has gained 31.51%, Ethereum has gained 29.67%, Solana has gained 27.45%, and Bitcoin has gained 22.50%. Today's decline is just a pause in a week that has repriced the entire market rather than a reversal of trend.
Among currencies with smaller market capitalizations, the divergence was extremely extreme: AGI rose 66.22%, ONG rose 39.31%, while DENT fell 29.06%, and VELVET fell 22.29%.
Summary
Bitcoin hit a 15-week high of $81,257, driven by a combination of short squeeze and the strongest week of ETF inflows since October 2025. Whether its rally can continue now depends on whether the market views $80,000 as a support level rather than a ceiling.
Short squeeze will not repeat itself, but ETF inflows will. The next week's trend will reveal which scenario the market prefers, and this is evident in the flow of funds statement before it becomes obvious on the chart. Today's market width data showed that 84 of 100 assets fell, while Bitcoin's market share climbed to 59.25%, indicating that the market has begun to make choices.