Exchange Ranking
 Top Exchanges
 24h Volume Ranking
 Popularity Ranking
 Exchange BTC Balance
 Proof of Reserves
 Decentralized Exchanges
 Funding Rate
 Funding Heatmap
 Liquidation Data
 Max Pain
 Long/Short Ratio
 Whale L/S Ratio
 Binance/Okex/Huobi L/S
 Bitfinex Margin L/S
 ETF Tracker
 Solana ETF
 XRP ETF
 Hong Kong ETF
 Bitcoin Treasuries
 Crypto Reversal
 Ethereum Reserves
 HyperLiquid Wallet Analysis
 Hyperliquid Whale Watch
 Large Transactions
 On-chain Movement
 Bitcoin ROI
 Stablecoin Market Cap
 Options Analysis
 News
News Articles
 Economic Calendar
 Features
 Wallet
 Contract Calculator


 Security
 Collections
 Watchlist
 Following
 DOT
DOT Polkadot Price Forecast: Market Overview
Polkadot is at a critical moment.$ DOT has just emerged from a months-long downward trend. At the same time, the on-chain referendum support rate for dotUSD stablecoins has reached 97.5%, and market sentiment is high. This week alone, the currency rose 42.5%, becoming the largest gainer asset in the top 50 largest currencies in the week, and 24-hour trading volume also soared to more than $338 million. This article's Polkadot price forecast will analyze whether this breakthrough is sustainable. The following is what the chart shows.
Market data verification time: September 9, 2026 UTC-3 01:12
Indicator value Price $1.2061 24-hour change +12% Market value $2.05 billion Fully diluted valuation (FDV)$2.53 billion 24-hour trading volume $437.1 million Trading volume/market value ratio (24h)21.4% Total supply 1.7 billion Maximum supply 2.1 billion in circulation supply 1.7 billion Data source: CoinMarketCap, as of September 9, 2026 UTC-3 01:12. Data from other tracking sites may differ slightly.
Today's Polkadot Crypto News: dotUSD referendum drives $DOT rebound
According to The Defiant's tweet on social media, Polkadot holders are voting on dotUSD. This is a protocol-native stablecoin with no separate issuer and initial funding consisting of USDT of $2.5 million and DOT of $2.5 million.
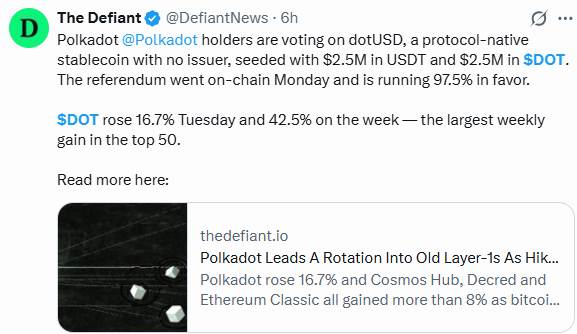
The referendum was launched on Monday and currently stands at 97.5%. The same post noted that DOT rose 16.7% on Tuesday and 42.5% this week, the biggest midweek gain for the top 50 tokens by market cap, a catalyst that has been at the heart of most Polkadot price prediction discussions.
$DOT Price Forecast: Volume Surge Exceeds $338 Million
Another tweet states that Polkadot's 24-hour trading volume exceeded $338 million, which is in line with dotUSD's price movement after the vote.

Increased volume accompanying a breakout usually means there is real participation behind it, not a few large orders, which adds weight to the current $DOT price forecast 2026 layout.
$DOT Price Forecasting Technical Analysis
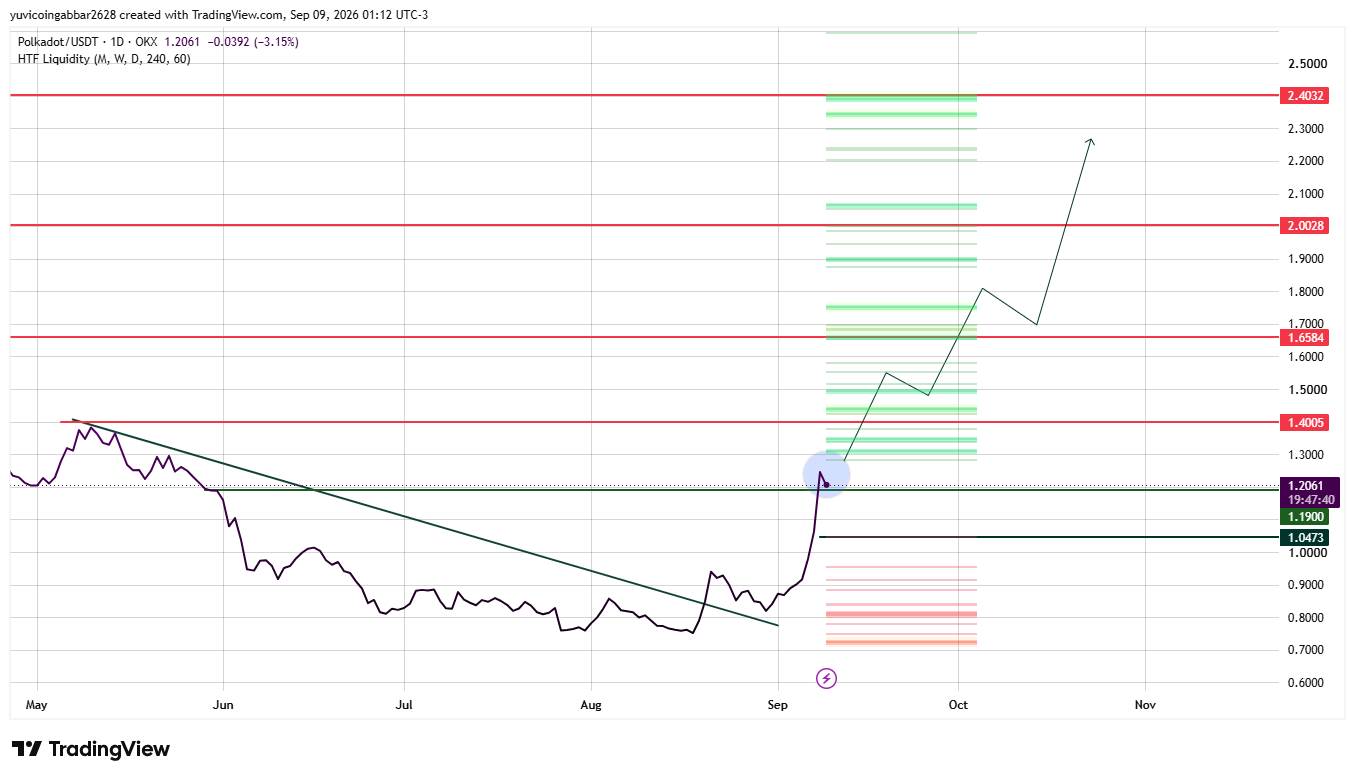
Trading Pair: DOT/USDT ·Market: Spot (Cryptocurrency)·Exchange: OKX ·Timeframe: Daily Line·Source: TradingView ·Timestamp: September 9, 2026 UTC-3 01:12
DOT is currently trading around $1.2061, having previously exceeded a downtrend line that has suppressed prices since its May high. The rally was strong and prices are currently testing the $1.1900 area, which is consistent with the trend line breakout area. The chart's liquidity map shows a thick resistance band formed above the current price between $1.4005 and $2.4032, while a thin support band below $1.0473. Stay above $1.1900 to maintain the effectiveness of the breakthrough; if it falls below, the effectiveness of the breakthrough will be questioned.
 $DOT Future Prices: Key Level
Horizontal Type Price Resistance 4$2.4032 Resistance 3$2.0028 Resistance 2$1.6584 Resistance 1 (Recent)$1.4005 Instant Price Reference $1.2061 First Confirmed Support (Trend Line Area)$1.1900 Deep Support $1.0473 Polkadot Price Forecast: Bull and Bear Market Scenarios
Bull Market Scenarios: If it can be maintained above $1.1900, the recovered trend line area will keep the breakthrough structure intact, especially as the dotUSD referendum continues to bring new Polkadot crypto news. A confirmed close above $1.4005 will open the door to $1.6584 and ultimately $2.0028.
Bear market scenario: A return to below $1.1900 will weaken the effectiveness of the trend line recovery and suggest that the rally may be a government-driven pulse rise rather than a sustained trend shift. Losing $1.0473 would expose deeper downside risks and lack support on the chart before lower levels.
$DOT Price Forecast: Trigger conditions and failure levels
Scenario trigger conditions possible result failure point Bulls continue to hold at $1.1900, break through $1.4005 move towards $1.6584 and $2.0028 Close below $1.1900 range Integration blocked at $1.4005, But stabilized above $1.1900 and fluctuated between $1.19 and $1.40, consolidated below $1.1900, bearish crash, lost $1.1900 and $1.0473, and further pulled back to lower liquidity territory. Can N/A $DOT reach $2.40?
$2.4032 is the highest resistance level marked on the chart. To reach this level, DOT needs to clear $1.4005,$1.6584, and stabilize itself above $2.0028, a multi-stage climb that may require the dotUSD narrative and volume trends to continue to strengthen.
Polkadot Price Forecast and Outlook
Looking at an extended cycle, DOT's breakthrough from its multi-month downward trend is a meaningful structural shift, not just a one-day pulse rise. If the dotUSD referendum passes and momentum continues, Polkadot price forecasts tend to retest $1.4005 and $1.6584 in the coming weeks, with $2.00 above being a realistic possibility only when broader market conditions match. The bigger question is whether this governance catalyst will translate into continued online activity or fade away after the news cycle.
Polkadot 2026 Price Forecast: Expert Opinion
According to CoinGabbar analysts, a breakthrough in the trend line, coupled with governance catalysts and rising trading volume, makes this situation stronger than a typical rebound, but $1.1900 is the key level to determine its sustainability. Please pay close attention to the area in the next few trading days.
Disclaimer
This document is for reference only and does not constitute financial advice. The above levels and scenarios are based on technical chart analysis and publicly available data at the time of writing, and the cryptocurrency market can fluctuate violently within hours, so past patterns cannot guarantee future results. Before taking any action, it is worth conducting independent research and considering your own risk tolerance.