Exchange Ranking
 Top Exchanges
 24h Volume Ranking
 Popularity Ranking
 Exchange BTC Balance
 Proof of Reserves
 Decentralized Exchanges
 Funding Rate
 Funding Heatmap
 Liquidation Data
 Max Pain
 Long/Short Ratio
 Whale L/S Ratio
 Binance/Okex/Huobi L/S
 Bitfinex Margin L/S
 ETF Tracker
 Solana ETF
 XRP ETF
 Hong Kong ETF
 Bitcoin Treasuries
 Crypto Reversal
 Ethereum Reserves
 HyperLiquid Wallet Analysis
 Hyperliquid Whale Watch
 Large Transactions
 On-chain Movement
 Bitcoin ROI
 Stablecoin Market Cap
 Options Analysis
 News
News Articles
 Economic Calendar
 Features
 Wallet
 Contract Calculator


 Security
 Collections
 Watchlist
 Following
 BTC
BTC Bitcoin has stabilized and rebounded above $76,500, with technical indicators and on-chain data suggesting a new round of gains is ready.
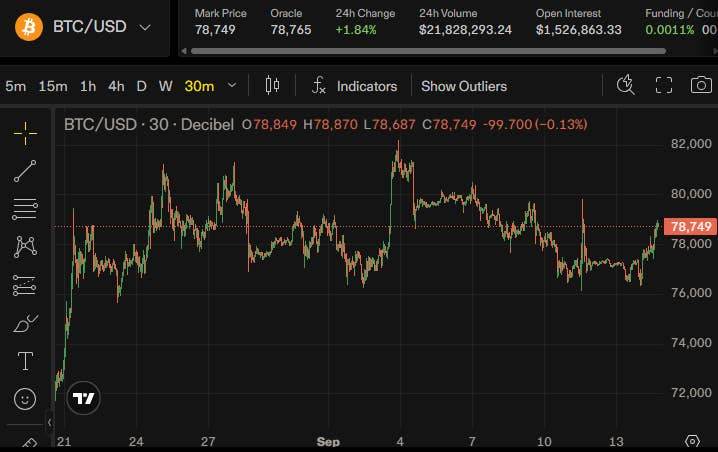
Bitcoin has shown renewed strength (meaning "renewed strength") after rebounding from key support of $76,500. Combined with technical indicators and on-chain data, the cryptocurrency seems to be preparing to hit higher prices again.
Analysis of Key Support and Resistance Levels
Crypto market analyst Wealthmanager recently pointed out that Bitcoin has achieved significant recovery after regaining the resistance level of US$77,500. The rally was built on strong defense at the lower edge of the main trading range that traders watch closely.
If Bitcoin can continue to stand above $77,500, analysts believe it will clear the way and give it a chance to test the next resistance area-$80,000. Given that Bitcoin has struggled to maintain momentum above $80,000 over the past few trading days, market participants generally regard this level as an important milestone.
US$77,500 remains the key game area for short-term prices. If it can break through and stabilize above this range, it will consolidate Bitcoin's recovery trend; on the contrary, if it cannot be maintained, it may cause the market focus to return to downward support levels such as US$76,500. During the most recent trading window, Bitcoin's price fluctuations ranged between $76,400 and $76,700.
As of the latest quote, the price of Bitcoin was US$77,612, an increase of 1.11% in the past 24 hours. Trading volume reached US$112.56 billion, with a total market value of approximately US$1.56 trillion.
Technical momentum and on-chain signals
In addition to price trends, changes in on-chain data have also attracted widespread attention from the crypto investment community. Analyst CryptoGoos pointed to a potential kinetic shift in Bitcoin, citing the MVRV Momentum Oscillator's return to above the zero axis. In past market cycles, this technical signal has often marked a critical stage in which the market adds value rapidly.
CryptoGoos emphasized: "The MVRV momentum oscillator is re-crossing the zero-axis upward. Whenever this happens, the strongest main rising waves in the bull market follow: 2012, 2016, 2019 and 2023. Missing this stage means missing out on the biggest gain during the bull market."
The MVRV indicator provides background information to determine whether the holder is in an unrealized profit or loss by comparing the market value of Bitcoin with its realized price. Oscillator momentum above the zero axis usually suggests the formation of bullish conditions and the arrival of a potential expansion phase, but this does not guarantee a recurrence of the same price movements seen in previous market cycles.
Noun explanation:
MVRV momentum oscillator: A market indicator that measures the difference between Bitcoin's market value and realized value, often used to identify whether the average holder is profitable or losing money, and to evaluate the market cycle.
Moving averages and Bollinger Bands Indicators
Currently, Bitcoin is trading at $77,611, above its 50-day exponential moving average (EMA) of $77,080. The 100th EMA currently stands at US$73,353, while the 200th EMA is US$73,028. As long as prices remain above these levels, these moving averages indicate continued bullish momentum.
Potential price scenario derivation
Current Bollinger band data shows that Bitcoin's middle track is at US$78,444, with the top track at US$80,970, and the bottom track at US$75,919. At this stage, Bitcoin prices are still below the mid-track, which indicates that selling pressure still exists in the short term. If it can break through US$78,444 upwards, it will provide additional momentum to move towards US$80,000.
In order to maintain its bullish momentum, Bitcoin needs to hold on to the $77,500 line of defense and regain $78,444 before launching a new offensive against the $80,000 to $80,970 resistance zone. Given the strength of Bitcoin's rebound from low levels, a breakthrough of $80,000 may attract more traders 'attention.
In terms of downside risks, if Bitcoin fails to hold on to $77,500, it may test the support levels of $76,500 and $75,919 again. Losing these key supports could undermine the current bullish trend and signal continued consolidation.
Although holding above the US$77,500 support and potential MVRV momentum reversal present a favorable environment for bulls, Bitcoin still needs to break through key resistance points to confirm a new stage of growth. Bitcoin is currently at a decisive crossroads, and the recent price rebound and improving on-chain conditions have laid the foundation for optimistic forecasts. However, technical resistance levels and historical volatility also remind investors of the need to maintain cautious monitoring in the coming trading session.