Exchange Ranking
 Top Exchanges
 24h Volume Ranking
 Popularity Ranking
 Exchange BTC Balance
 Proof of Reserves
 Decentralized Exchanges
 Funding Rate
 Funding Heatmap
 Liquidation Data
 Max Pain
 Long/Short Ratio
 Whale L/S Ratio
 Binance/Okex/Huobi L/S
 Bitfinex Margin L/S
 ETF Tracker
 Solana ETF
 XRP ETF
 Hong Kong ETF
 Bitcoin Treasuries
 Crypto Reversal
 Ethereum Reserves
 HyperLiquid Wallet Analysis
 Hyperliquid Whale Watch
 Large Transactions
 On-chain Movement
 Bitcoin ROI
 Stablecoin Market Cap
 Options Analysis
 News
News Articles
 Economic Calendar
 Features
 Wallet
 Contract Calculator


 Security
 Collections
 Watchlist
 Following
 XRP
XRP Ripple的XRP价格面临技术测试:13年历史中RSI触及极端低位
在分析师展示的13年图表历史中,两周相对强弱指数(RSI)读数跌至最低区域,导致Ripple的XRP价格面临一次技术测试。这一形态之所以引人注目,是因为XRP在突破引导该资产穿越多个市场周期的上升趋势结构之前,已经达到了这种极端状态。
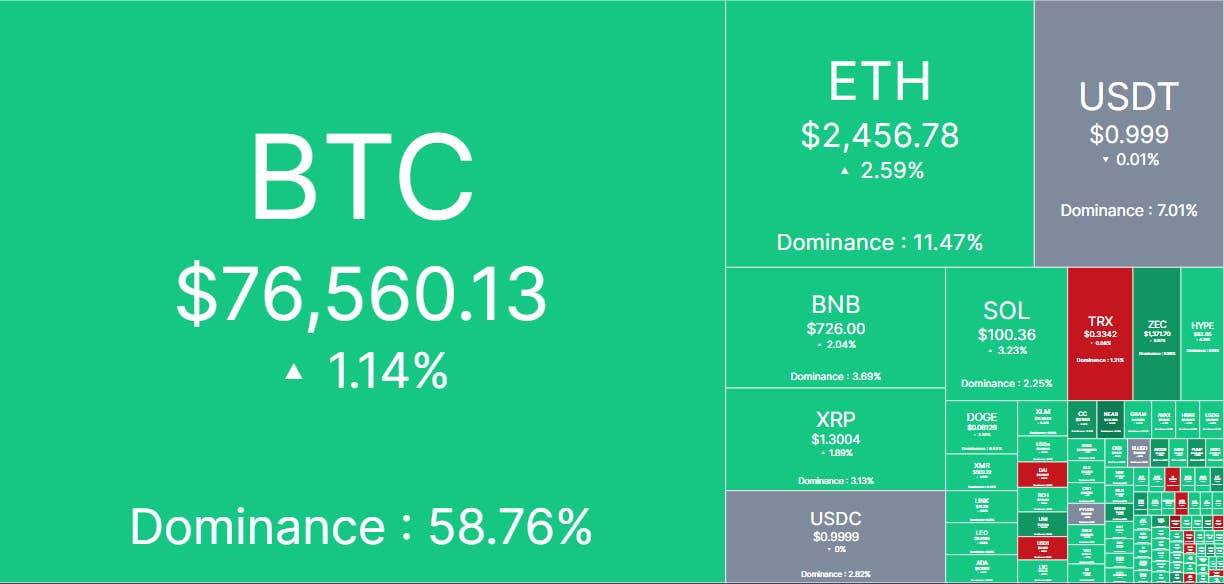
XRP图表将当前的RSI状况与之前的严重抛售时期进行了对比,包括2018年的熊市、2020年的新冠疫情崩盘以及2022年的低迷期。截至撰写本文时,XRP价格交易在1.30美元附近,CoinGecko数据显示其市值约为816亿美元。
XRP价格保持在关键上升趋势结构之上
我们查看了XRP/USD的两周线图,最重要的特征是价格下方的上升趋势支撑结构。该图表追踪了从XRP早期年份到后续市场周期的一系列更高低点,而最新的下跌使Ripple的XRP价格重新接近该下边界。
当前的价格走势值得关注,因为XRP在9月14日从1.49美元下跌至9月15日盘中低点附近的1.27美元,随后回升至1.30美元左右。Coinbase数据显示,XRP在9月15日以约1.28美元收盘,此前最高交易至1.45美元,随后在9月16日上涨了1.17%。
This puts XRP prices close to the uptrend support area marked in analyst charts. A break below this structure will weaken the market pattern shown in the analysis; but if the structure is held, the multi-year trend line will remain intact.
The more unusual part of the chart is the RSI indicator. The indicator has dropped below the 30 level commonly used to define oversold conditions, and analysts have flagged it as the absolute lowest oversold level in the 13-year XRP history shown. The chart places this reading below the RSI conditions during the main selling periods in 2018, 2020 and 2022.
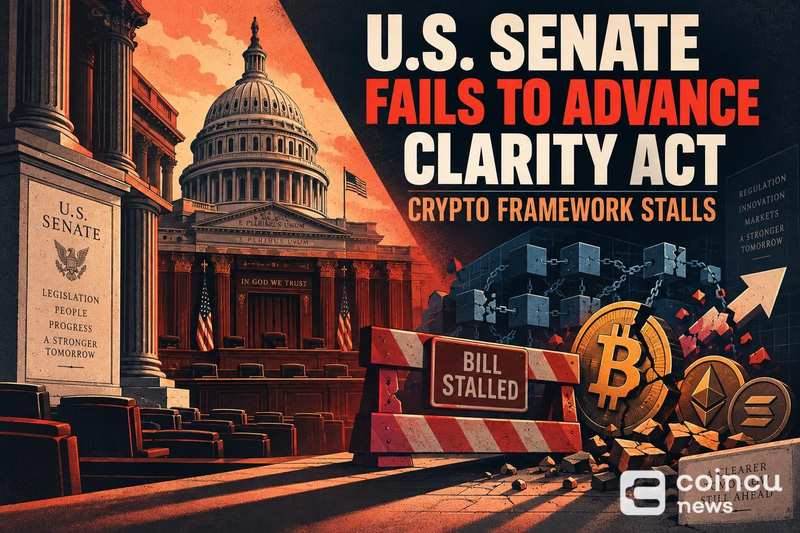
Related XRP News: XRP prices are under pressure after the CLARITY bill vote, but one indicator stands out
Analyst Cryptollica shares the same view, arguing that XRP's RSI exhaustion is deeper than in previous major market periods. An analysis in June that quoted the analyst pointed out that the RSI was at its lowest level in 13 years and pointed to an uptrend line below the XRP.

This does not guarantee that the XRP price will definitely reverse. If the sell-off continues, the oversold RSI may remain oversold and the uptrend line will still need to be held. September data demonstrated the speed of XRP's two-way movements: the token rose 6.09% on September 14, fell 9.80% on September 15, and then rebounded 1.22% on September 16.
因此,对于XRP价格而言,即时的技术性问题很简单:XRP能否保持在图表所示的上升趋势结构之上?如果能,分析师的历史比较就更具相关性,因为当前的形态结合了极端的RSI读数与仍处于多周期支撑之上的价格。
如果该支撑位失败,论点就会发生变化。XRP价格将打破在先前XRP周期中一直维持的结构,使得RSI的极端状态失去同样的技术基础。
目前,XRP图表呈现了两个可衡量的条件:异常低迷的两周RSI和正在接受测试的主要上升趋势线。
常见问题解答
XRP价格现在是否超卖?
是的。分析师图表中显示的两周RSI处于XRP 13年历史上的最低水平,低于2018年熊市、2020年新冠疫情崩盘和2022年熊市期间记录的读数。
如果当前支撑位守住,XRP价格能恢复吗?
复苏将取决于XRP是否能维持图表中显示的长期上升趋势支撑结构。守住该趋势线将使技术形态保持完整,但仅凭极端的RSI并不能保证反转。
尽管XRP具有长期的市场相关性,为何其价格仍在下跌?
文章的图表分析侧重于技术性抛压,而非新的基本面崩溃。XRP面临着沉重的价格压力,但多周期上升趋势结构仍如图表所示保持完整。