Exchange Ranking
 Top Exchanges
 24h Volume Ranking
 Popularity Ranking
 Exchange BTC Balance
 Proof of Reserves
 Decentralized Exchanges
 Funding Rate
 Funding Heatmap
 Liquidation Data
 Max Pain
 Long/Short Ratio
 Whale L/S Ratio
 Binance/Okex/Huobi L/S
 Bitfinex Margin L/S
 ETF Tracker
 Solana ETF
 XRP ETF
 Hong Kong ETF
 Bitcoin Treasuries
 Crypto Reversal
 Ethereum Reserves
 HyperLiquid Wallet Analysis
 Hyperliquid Whale Watch
 Large Transactions
 On-chain Movement
 Bitcoin ROI
 Stablecoin Market Cap
 Options Analysis
 News
News Articles
 Economic Calendar
 Features
 Wallet
 Contract Calculator


 Security
 Collections
 Watchlist
 Following
 ADA
ADA ADA's latest Tom DeMark Sequential buy signal: Historical rebound patterns attract attention again
After Cardano (ADA)'s latest Tom DeMark Sequential buy signal appeared, the market paid close attention to its trend. The indicator has sent similar signals three times before, followed by a strong rebound of as high as 50.9%. Currently, ADA trading prices are above its 50-day and 200-day moving averages, and the $0.196 to $0.203 range is becoming a key support area. If the price breaks above $0.24, it will open up space for paths to $0.256 and $0.275; conversely, if it breaks below support, it may drop to $0.178.
Analysts point to another ADA rally
Cardano's ADA receives a new Tom DeMark Sequential buy signal as token prices stay above the key moving average. Analyst Ali Charts recorded the signal on the ADA's daily chart. Looking back at historical data, the recent technical pattern settings on June 25, July 15 and August 18 this year predicted subsequent price rebounds of 44.5%, 11.5% and 50.9% respectively.
Analysts pointed out that the latest Sequential readings could signal another rally in the ADA. The indicator has previously marked three recent lows ahead of strong price movements. According to analysts, the June 25 signal preceded a 44.5% rise; the July 15 signal corresponded to an 11.5% increase; and the August 18 signal preceded a 50.9% increase. However, the latest signal comes against the backdrop of the ADA's recovery from a deeper decline, leaving traders watching whether the token can maintain its recent market structure.
ADA runs above key moving average
In March this year, ADA prices traded around $0.27 to $0.28, and then entered a long downward cycle. Selling pressure intensified in June, pushing token prices into the $0.158 to $0.16 range. Since then, the decline has stabilized between $0.14 and $0.16 in late June.
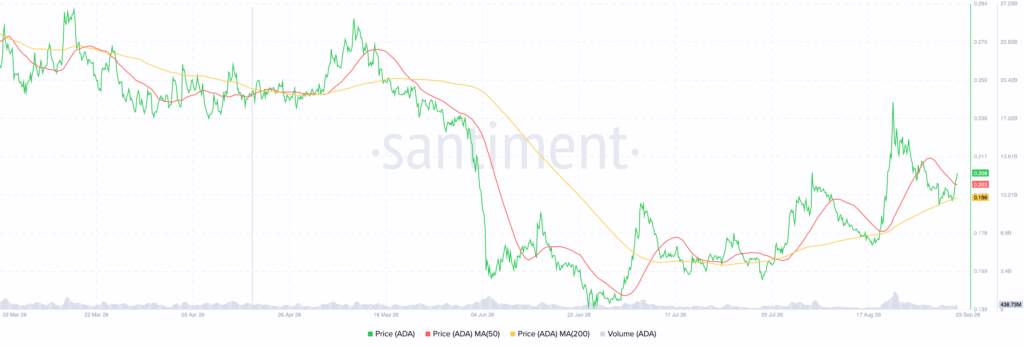
Since July, the ADA has reached a higher low and successfully exceeded $0.178. In August, the token price climbed to near $0.24, and then fell back again to around $0.20 due to profit-taking. Currently, ADA trading prices are around $0.208, while the 50-day moving average is around $0.203. At the same time, the 200-day moving average is around $0.196. ADA is still operating above these two moving averages, and the 50-day moving average has exceeded the 200-day moving average, forming a golden cross.
Resistance keeps traders focused
The current technical landscape establishes $0.196 to $0.203 as a key support area. Above it,$0.217 constitutes the first resistance level, followed by the high range of $0.236 to $0.240. During the rebound in August, this high range encountered strong pressure to refuse to sell. If the price effectively exceeds $0.24, it will expose room for development towards $0.256 or even $0.275. However, if support in the $0.196 to $0.203 region is lost, the ADA price may drop to $0.178. In addition, trading volume amplified during the August increase and then gradually returned to moderate levels.
With ADA trading around $0.208, this technical indicator provides another reference for the market. The current Relative Strength Index (RSI) is 66.60, with an average of 65.95, while the MACD line remains above the signal line, showing certain bullish momentum.