Exchange Ranking
 Top Exchanges
 24h Volume Ranking
 Popularity Ranking
 Exchange BTC Balance
 Proof of Reserves
 Decentralized Exchanges
 Funding Rate
 Funding Heatmap
 Liquidation Data
 Max Pain
 Long/Short Ratio
 Whale L/S Ratio
 Binance/Okex/Huobi L/S
 Bitfinex Margin L/S
 ETF Tracker
 Solana ETF
 XRP ETF
 Hong Kong ETF
 Bitcoin Treasuries
 Crypto Reversal
 Ethereum Reserves
 HyperLiquid Wallet Analysis
 Hyperliquid Whale Watch
 Large Transactions
 On-chain Movement
 Bitcoin ROI
 Stablecoin Market Cap
 Options Analysis
 News
News Articles
 Economic Calendar
 Features
 Wallet
 Contract Calculator


 Security
 Collections
 Watchlist
 Following
 BTC
BTC Analysts said that the previous four recoveries of "warm supply realization prices" have all precluded Bitcoin's rise of 34% to 159%.
Although spot demand has declined and capital flows have been mixed, analyst Ted Pillow believes that if Bitcoin's weekly closing firm above $83,000, the target price of $100,000 may still be achieved. At the same time, Bitcoin's Relative Strength Index (RSI) and MACD indicators are improving, with resistance levels of $80,000 to $81,000 and support levels of $78,000 remaining key observation points.
Bitcoin recovers key cost benchmark
According to analyst Ali Charts, Bitcoin is currently trading at close to US$79,300 after recovering its "warm supply realization price." This indicator tracks the amount of BTC that last moved between one week and six months ago. CryptoBullet and Ted Pillow also highlighted independent signals related to the Bitcoin cycle, spot demand and technical structure, respectively. Their comments come as Bitcoin tests resistance in the $80,000 region.
Ali Charts pointed out that the previous four recovery operations have preceded significant increases. The recovery in January 2023 brought in a 69% increase, while in October 2023 it brought in a gain of 159%. The October 2024 recovery precedes a 74% increase. At the same time, the April 2025 recovery precedes a 34% increase.
However, CryptoBullet said that if the July 1 level of $57,750 marks the bottom of the cycle, then the bearish scenario remains. He identified October 4, October 17 and November 21 as dates that match early bear market bottoms. CryptoBullet set December 1 as the deadline for him to turn fully bullish.
 The appearance of the gold fork is accompanied by a decline in spot demand
Ted Pillow reported that Bitcoin has recently formed a "gold fork" on the daily chart. But he also pointed out that spot demand is declining. Pillow said that if Bitcoin closes firmly above $83,000 on a weekly basis, it is expected to hit $100,000 this year.
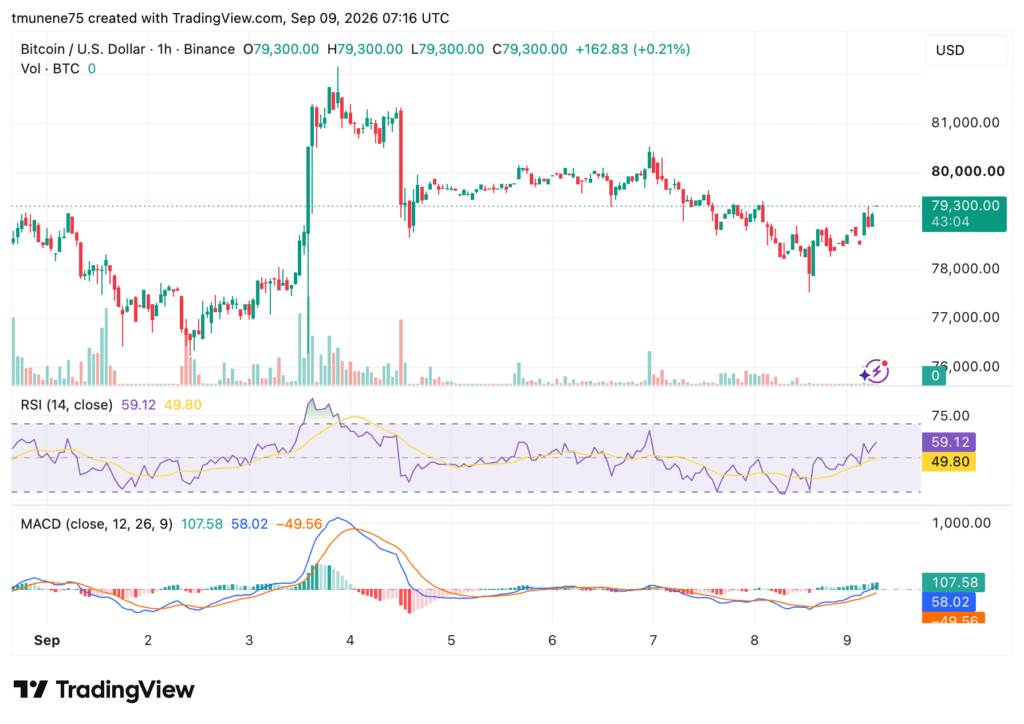
Current market data shows that the price of BTC is US$79,300. Bitcoin rebounded from the $77,700 to $78,000 region after a sell-off wave on September 8 - 9. It is still below $80,000, with resistance around $80,000 to $81,000. Support is around $78,000, with stronger protection in the $77,000 to $77,700 range.
Bitcoin momentum strengthens around US$80,000
Breaking through US$79,300 may make US$80,000 a touchable target. A breakthrough of $80,000 shifts the focus to $81,000 to $81,500. The RSI read at 59.12, above its moving average of 49.80, but still below the overbought threshold of 70.
Source: TradingView
At the same time, MACD has turned positive, showing values of 107.58 and 58.02 respectively. The bar chart has also entered the positive area. Spot capital flows remain mixed. Continued inflows could support a recovery towards $80,000 to $82,000, while continued outflows could expose downside risks of $77,000 and $75,600.